Product Management IEOR 186
The Team
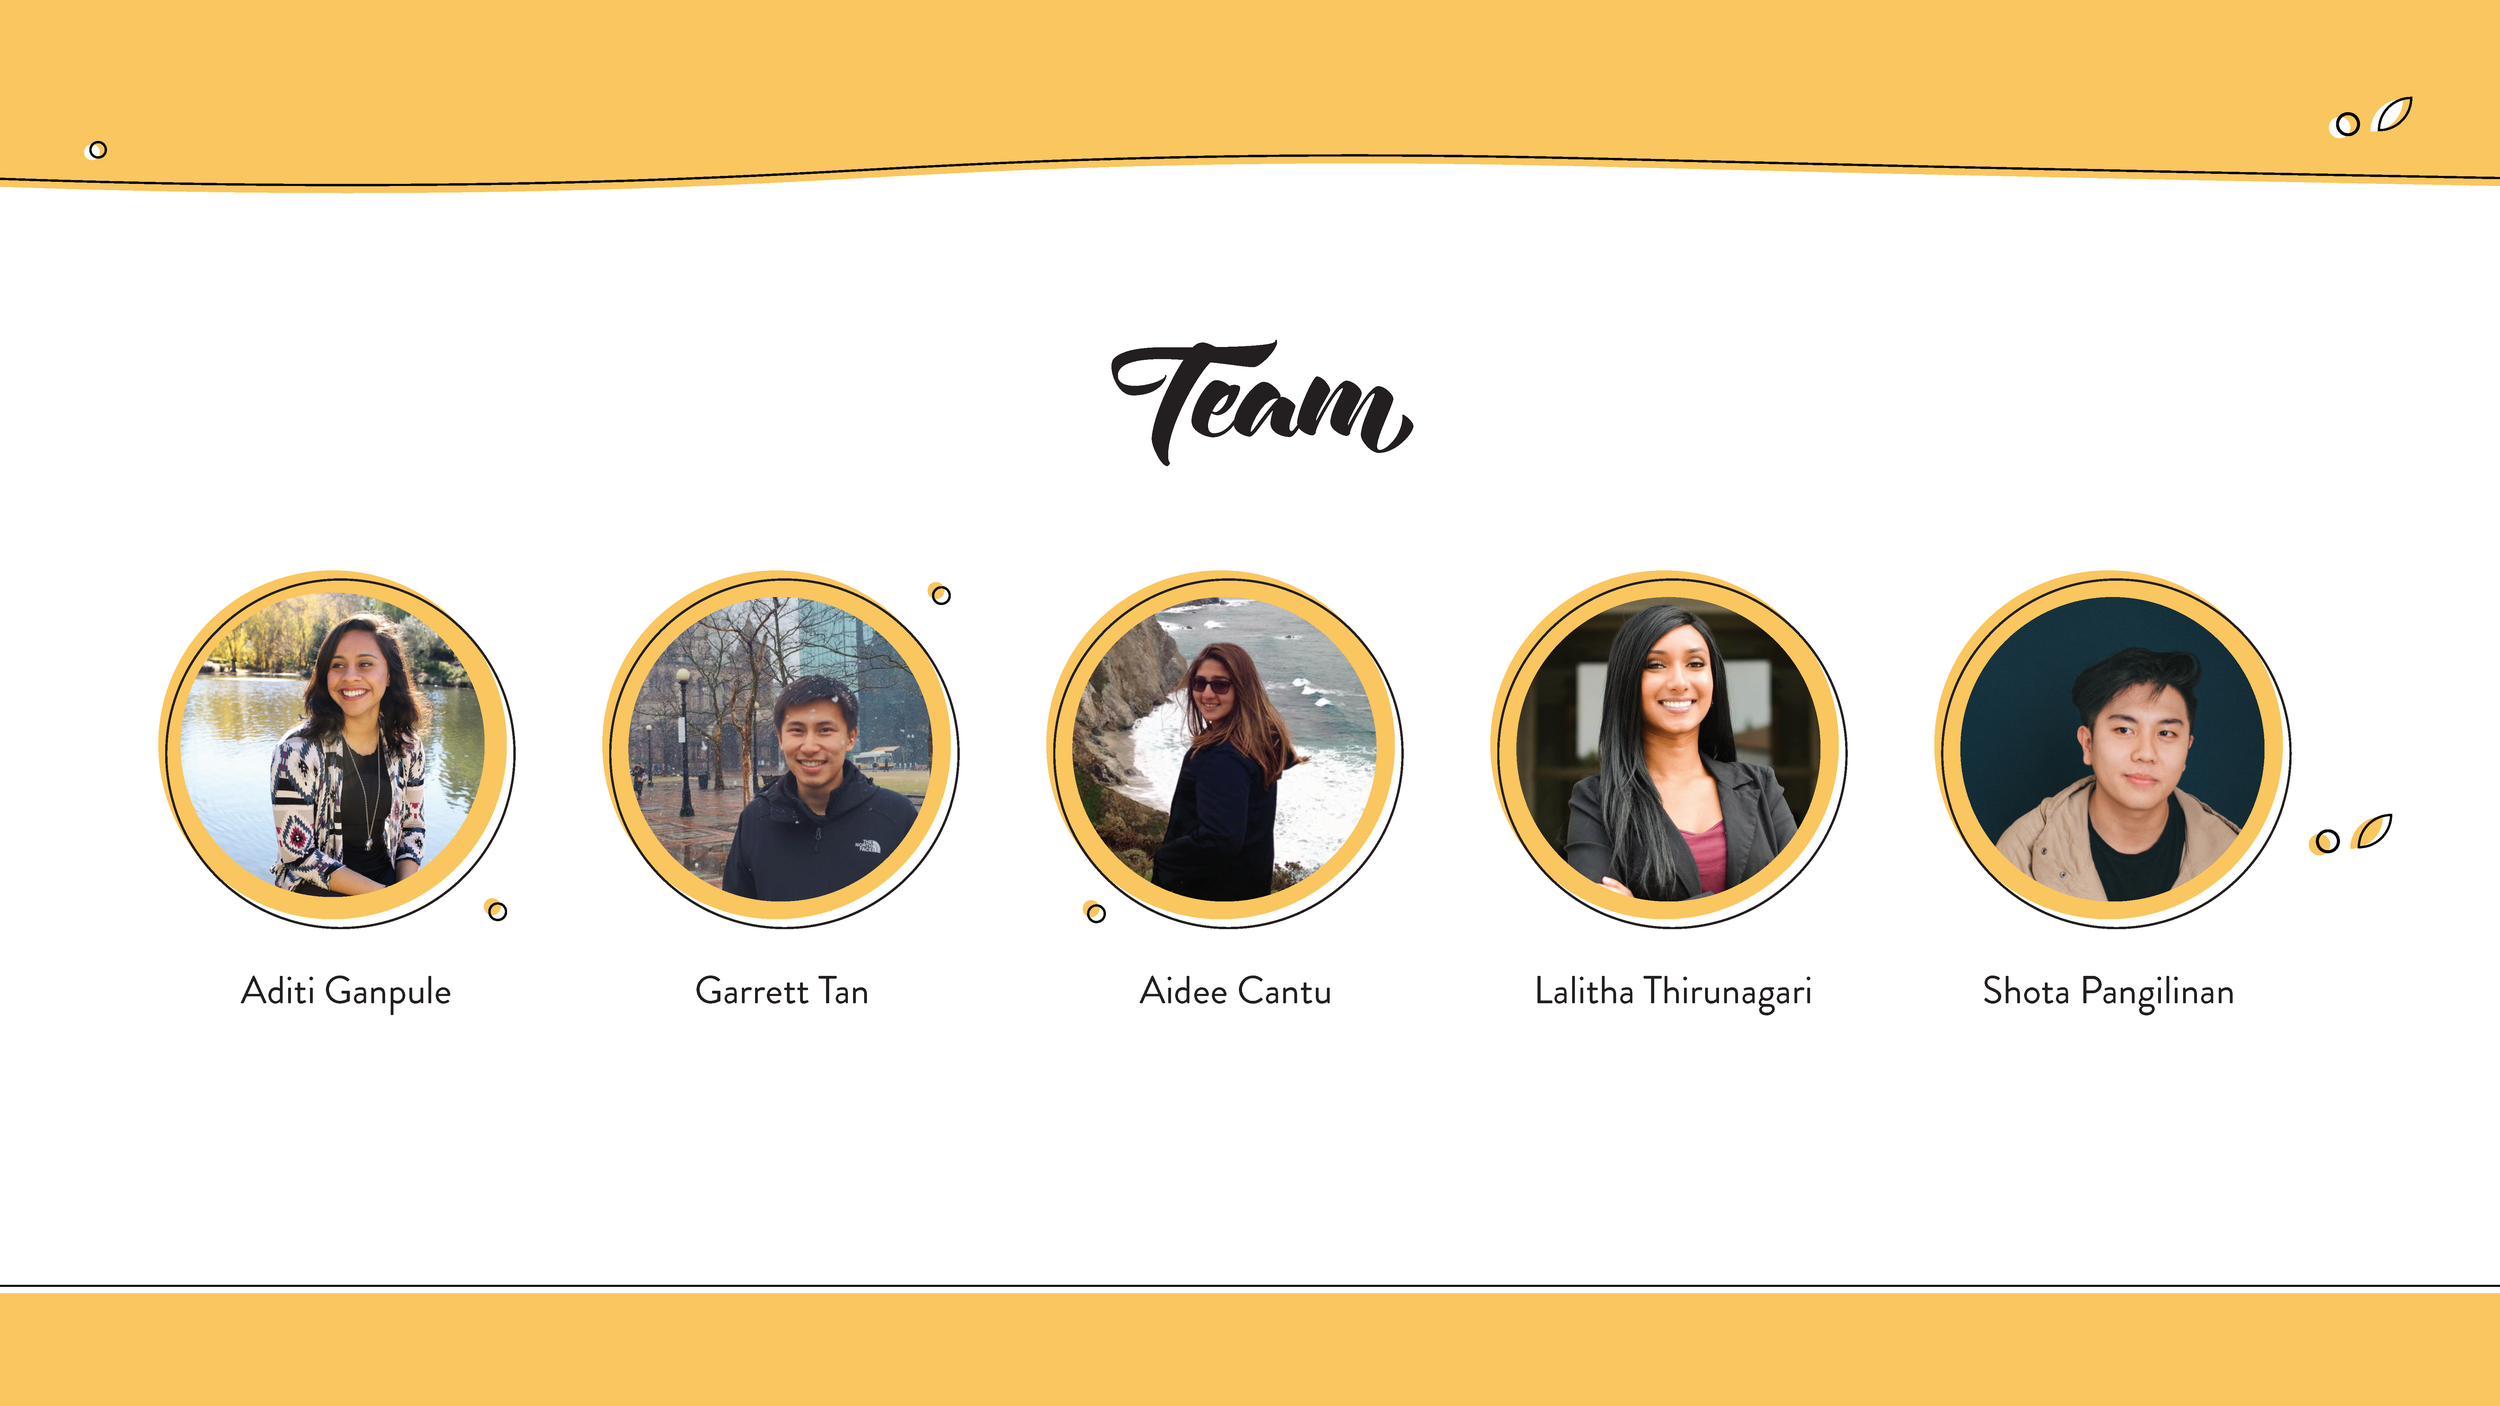
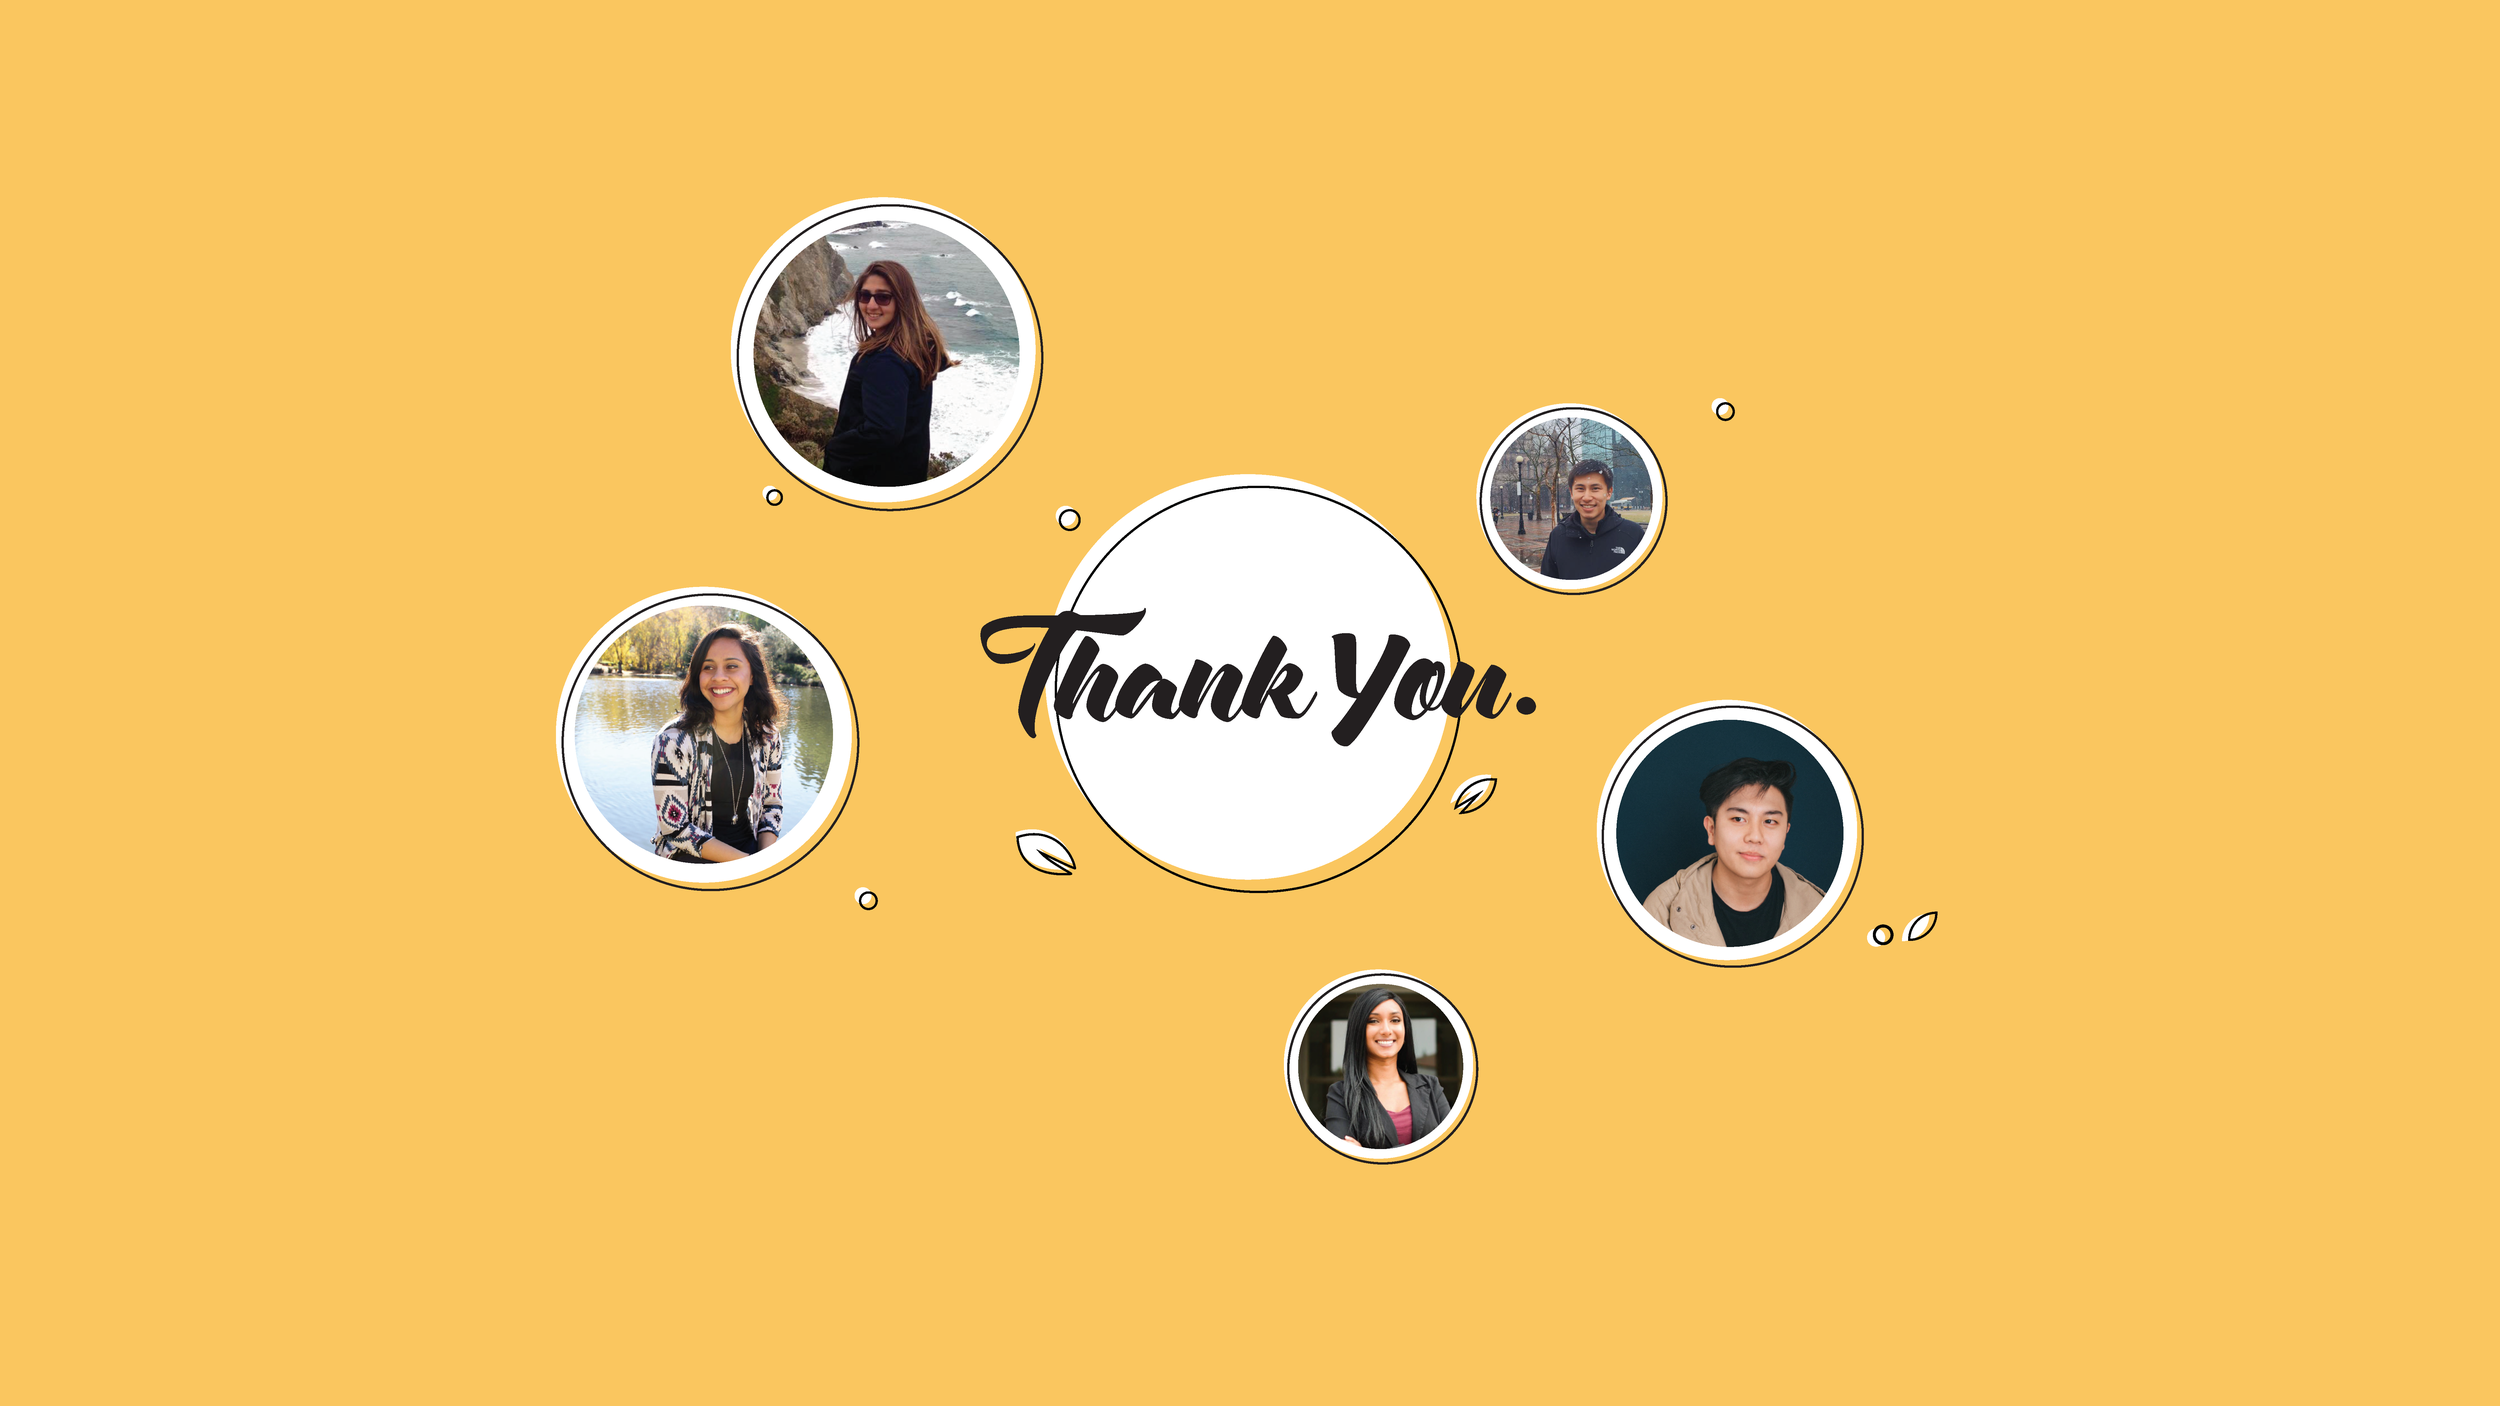
Our team was composed of 5 individuals Aditi Ganpule (EECS '17), Garrett Tan (EECS '17), & Aidee Cantu (Cogsci '17), Lalitha Thirunagari (Cogsci '16), & myself. On this team, I was the UI + Visual designer, creating all the UI/UX & collateral for the team, assisting in the business and concept development as well.
Creating the MVP
Attached is our pamphlet on the developing of our Minimum Viable Product & defining our market opportunities, for a more in depth look at how we came up with our concept.
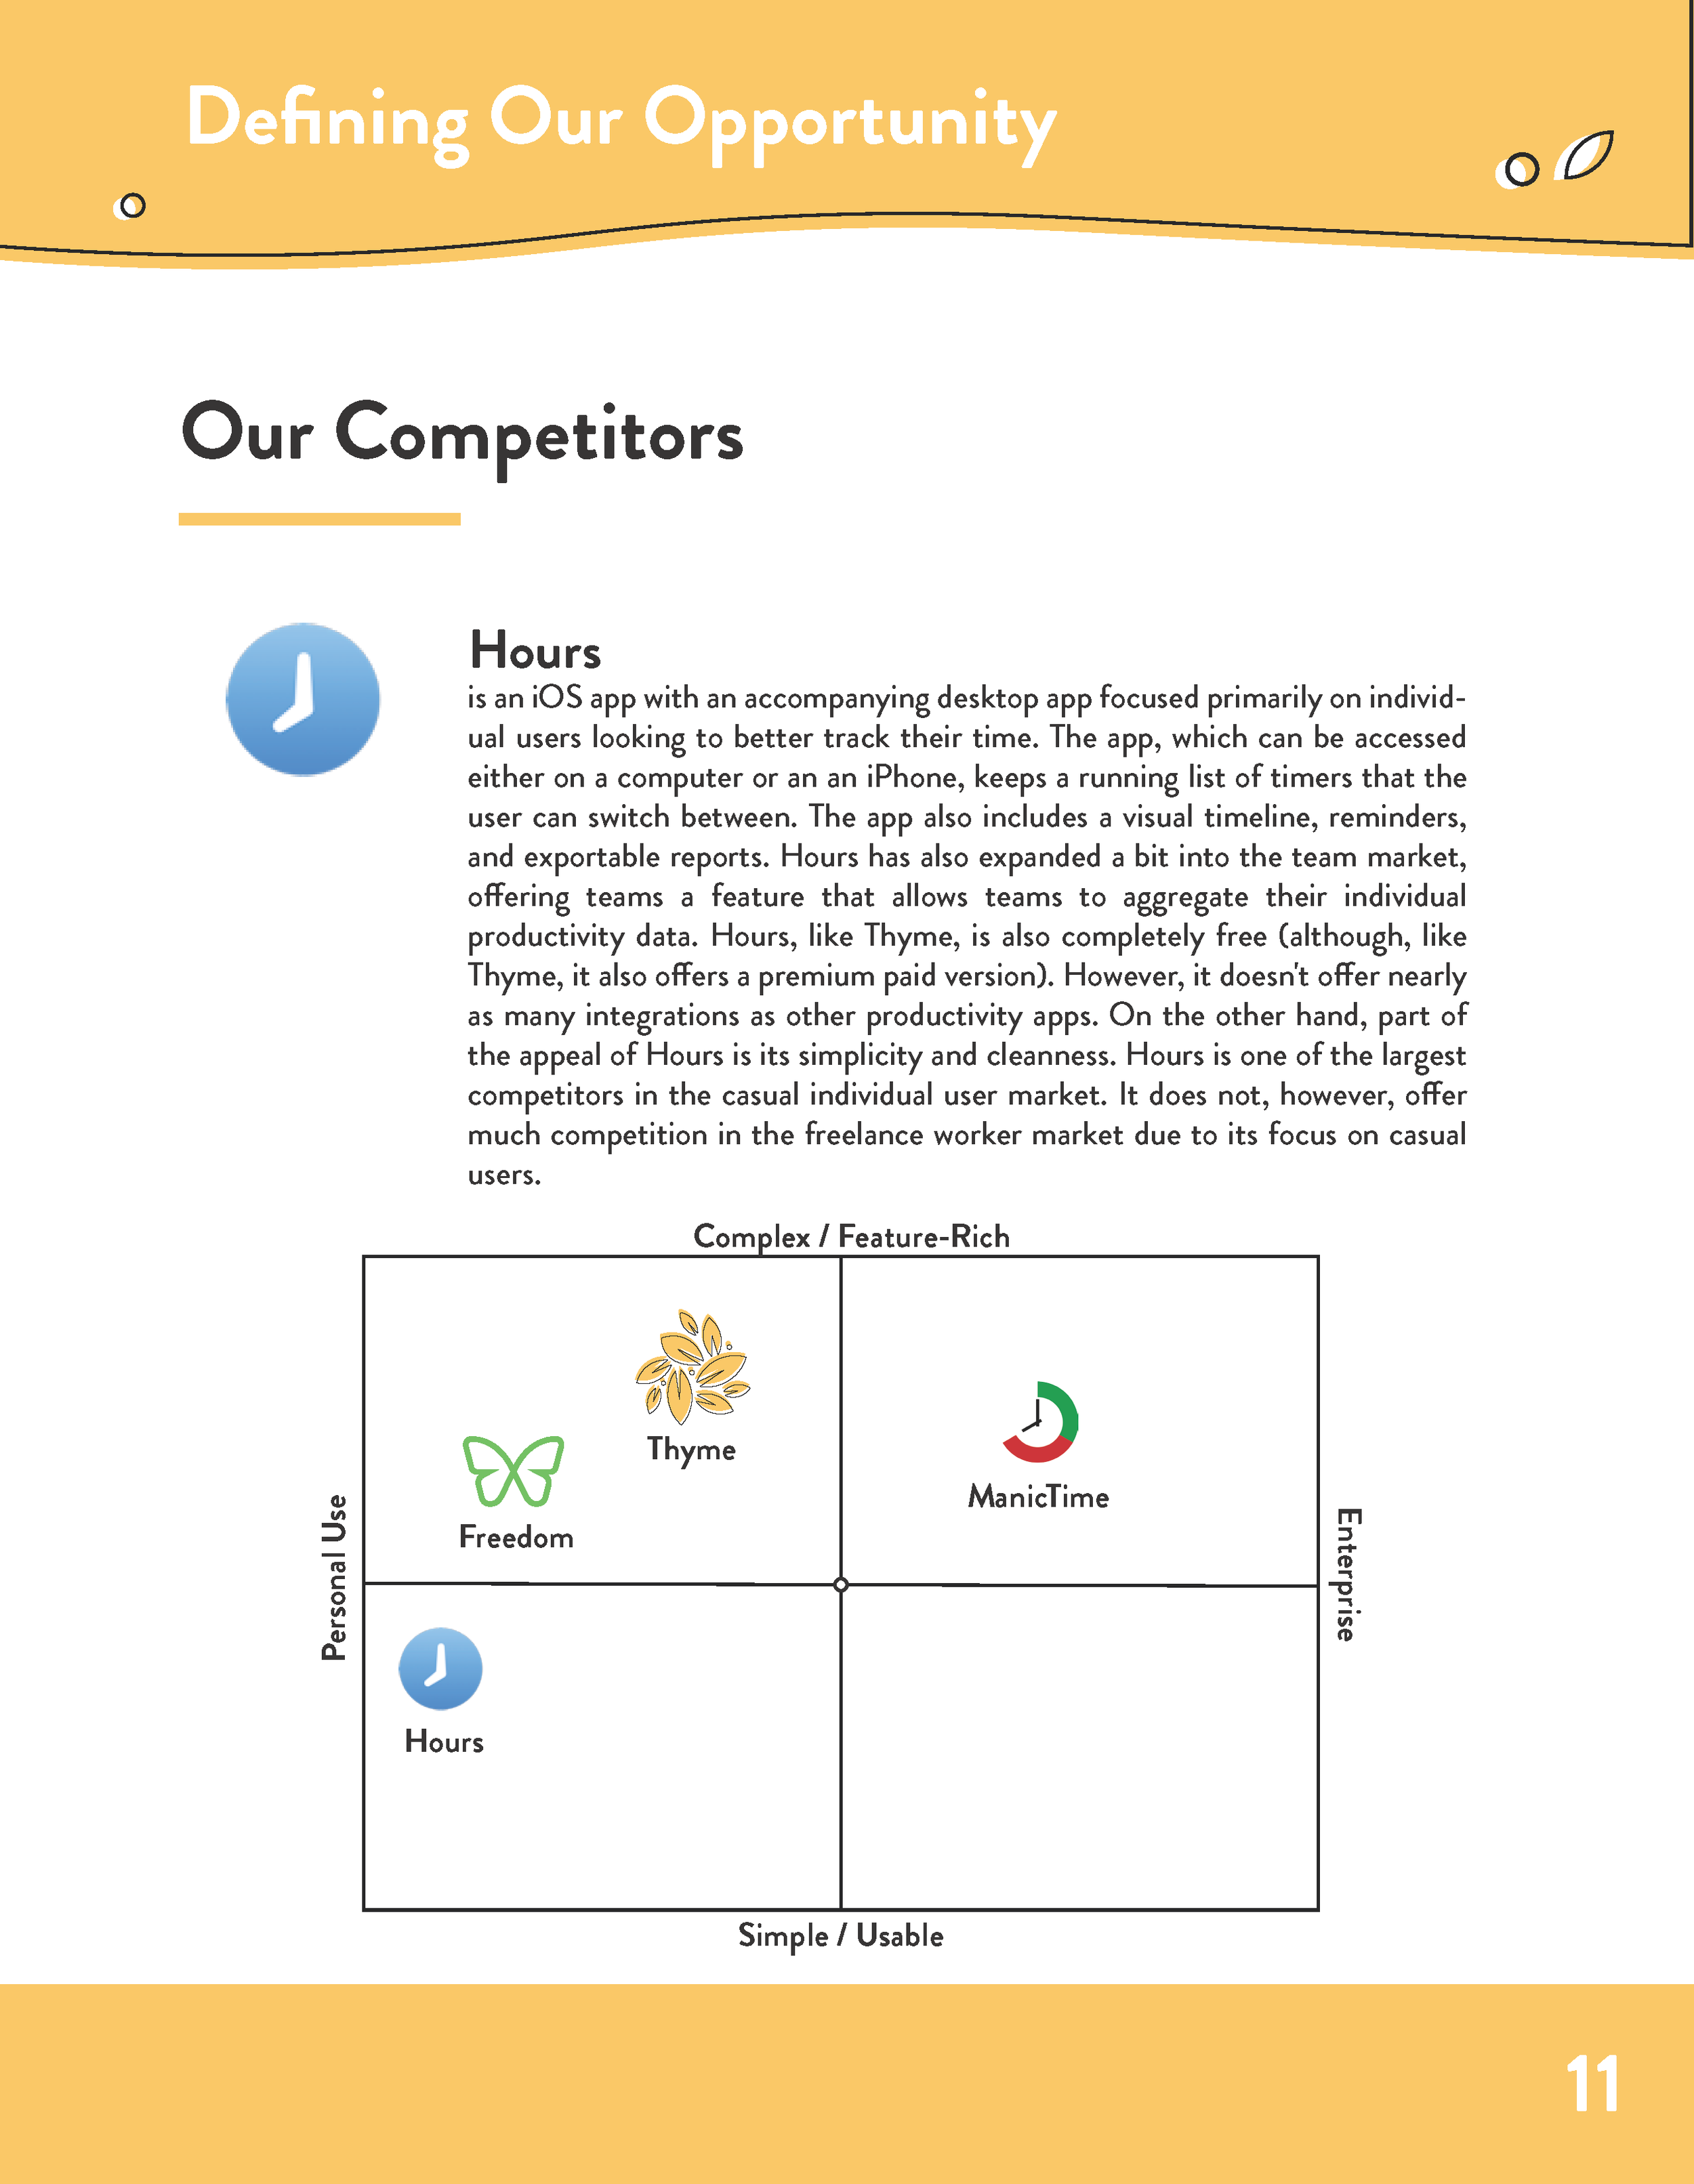
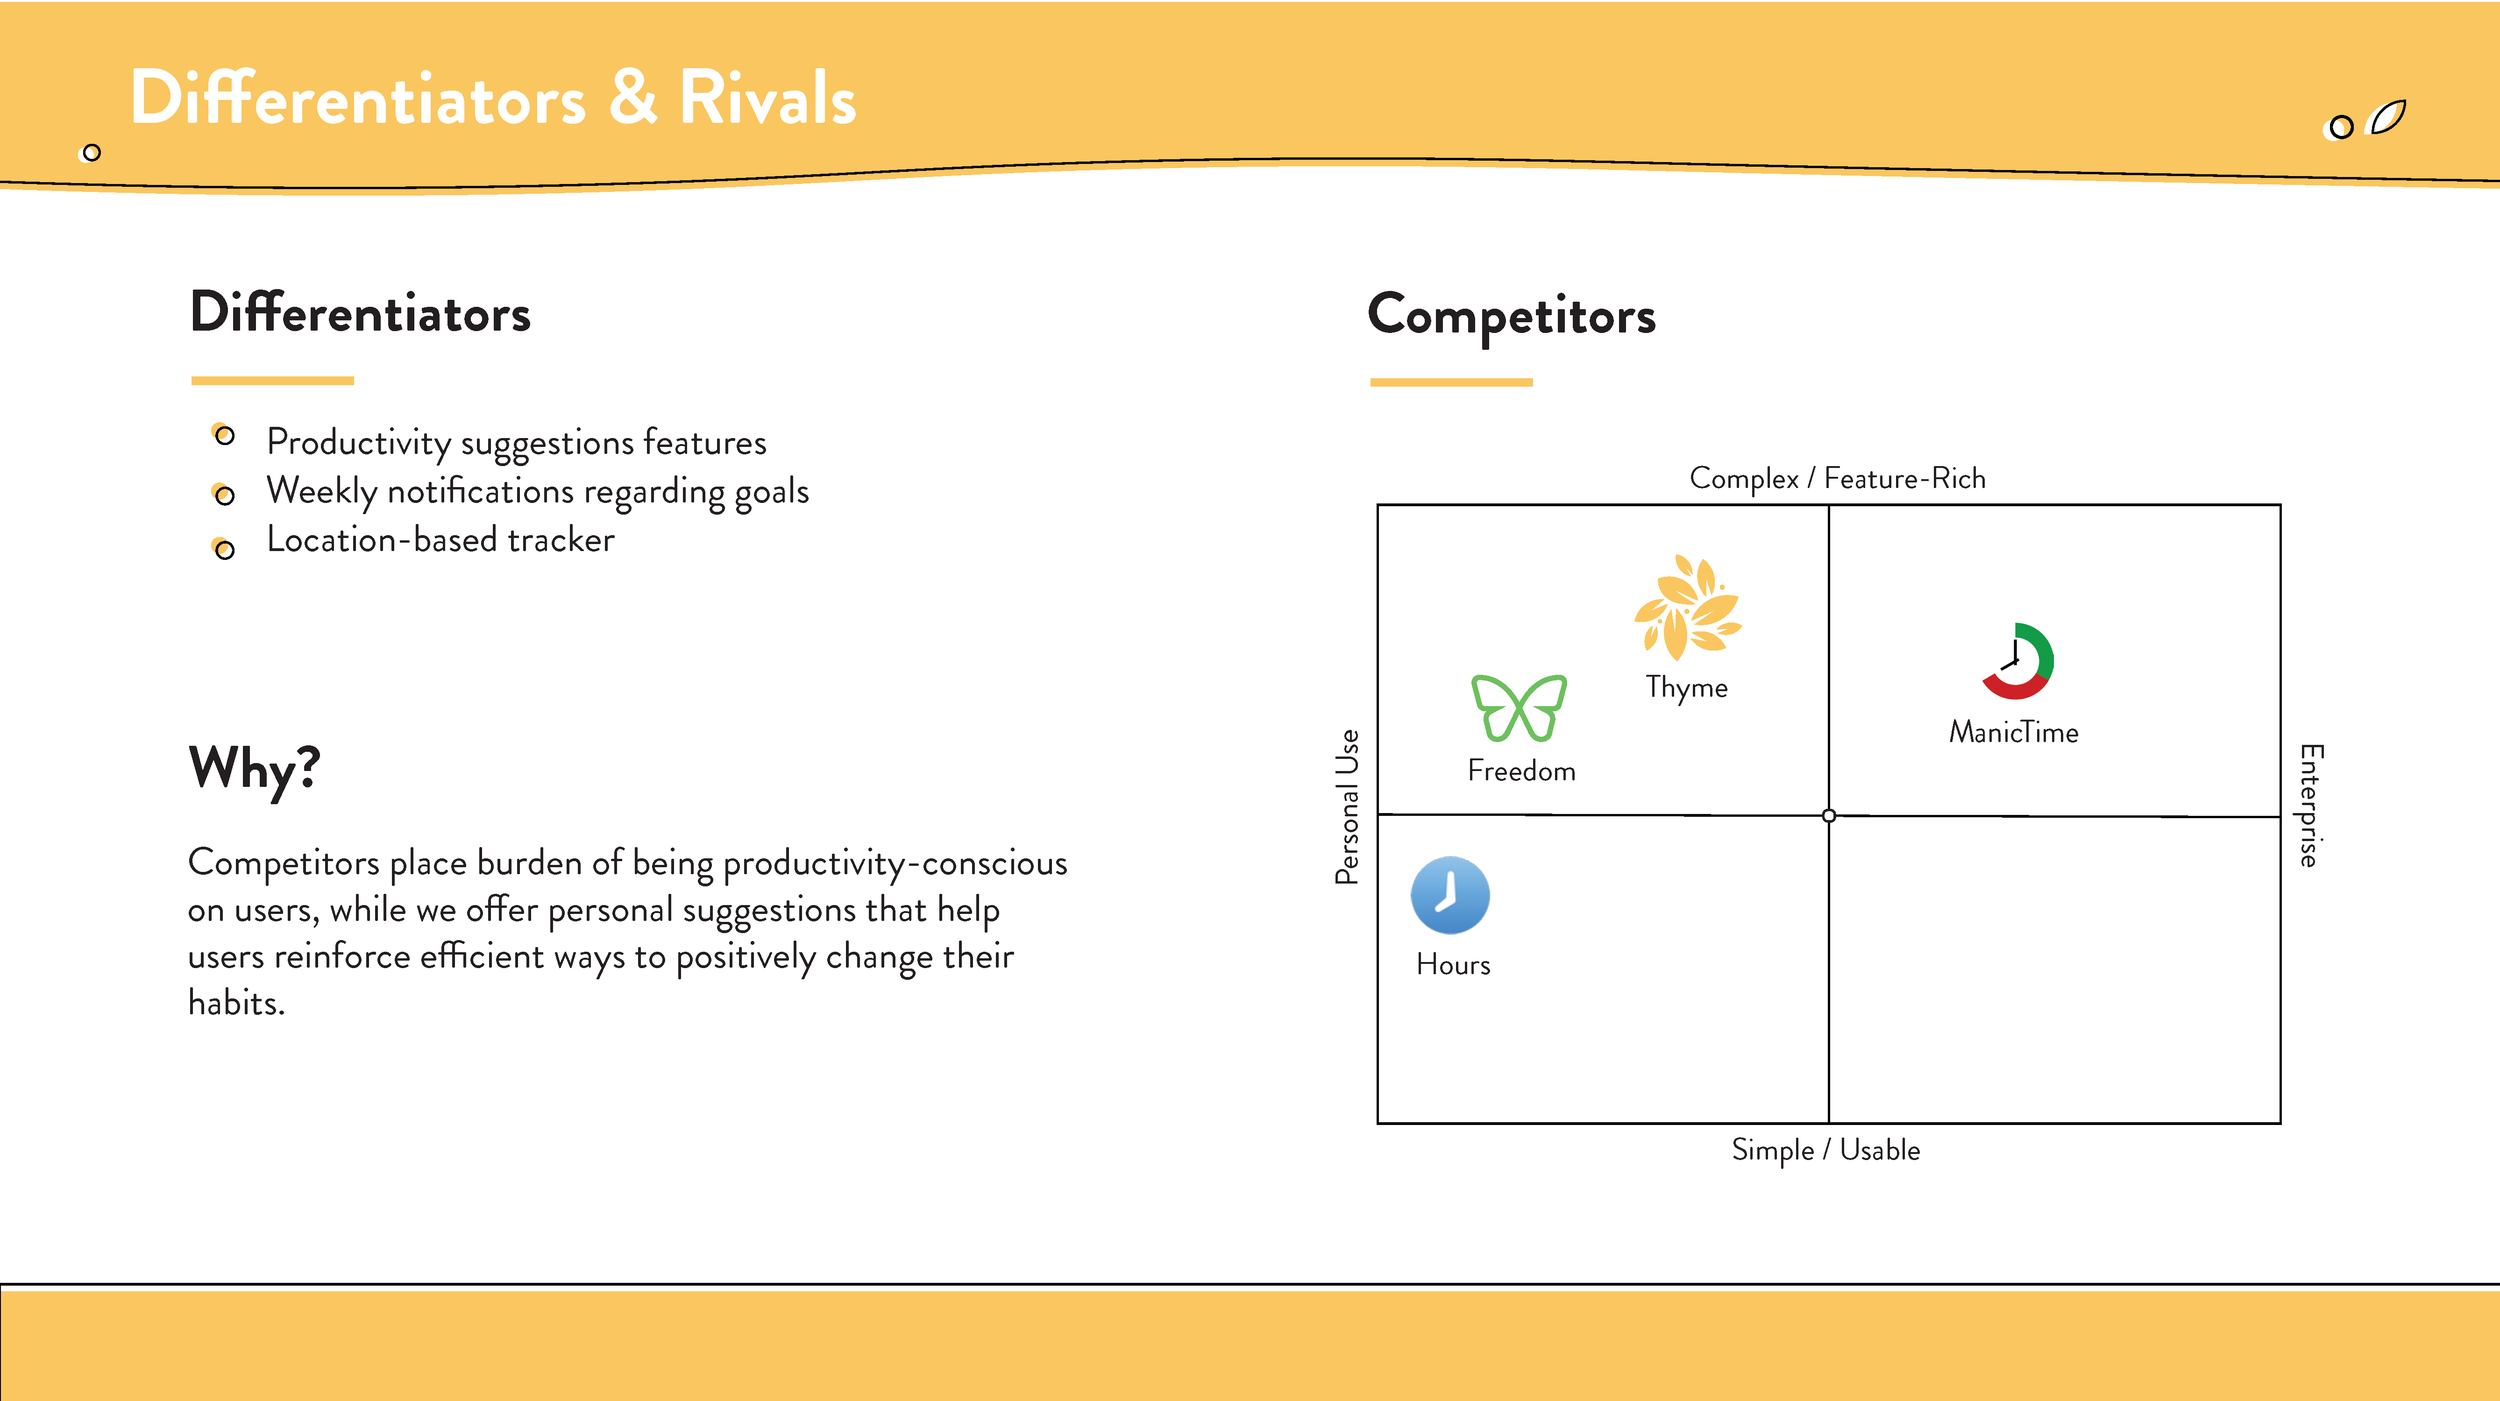
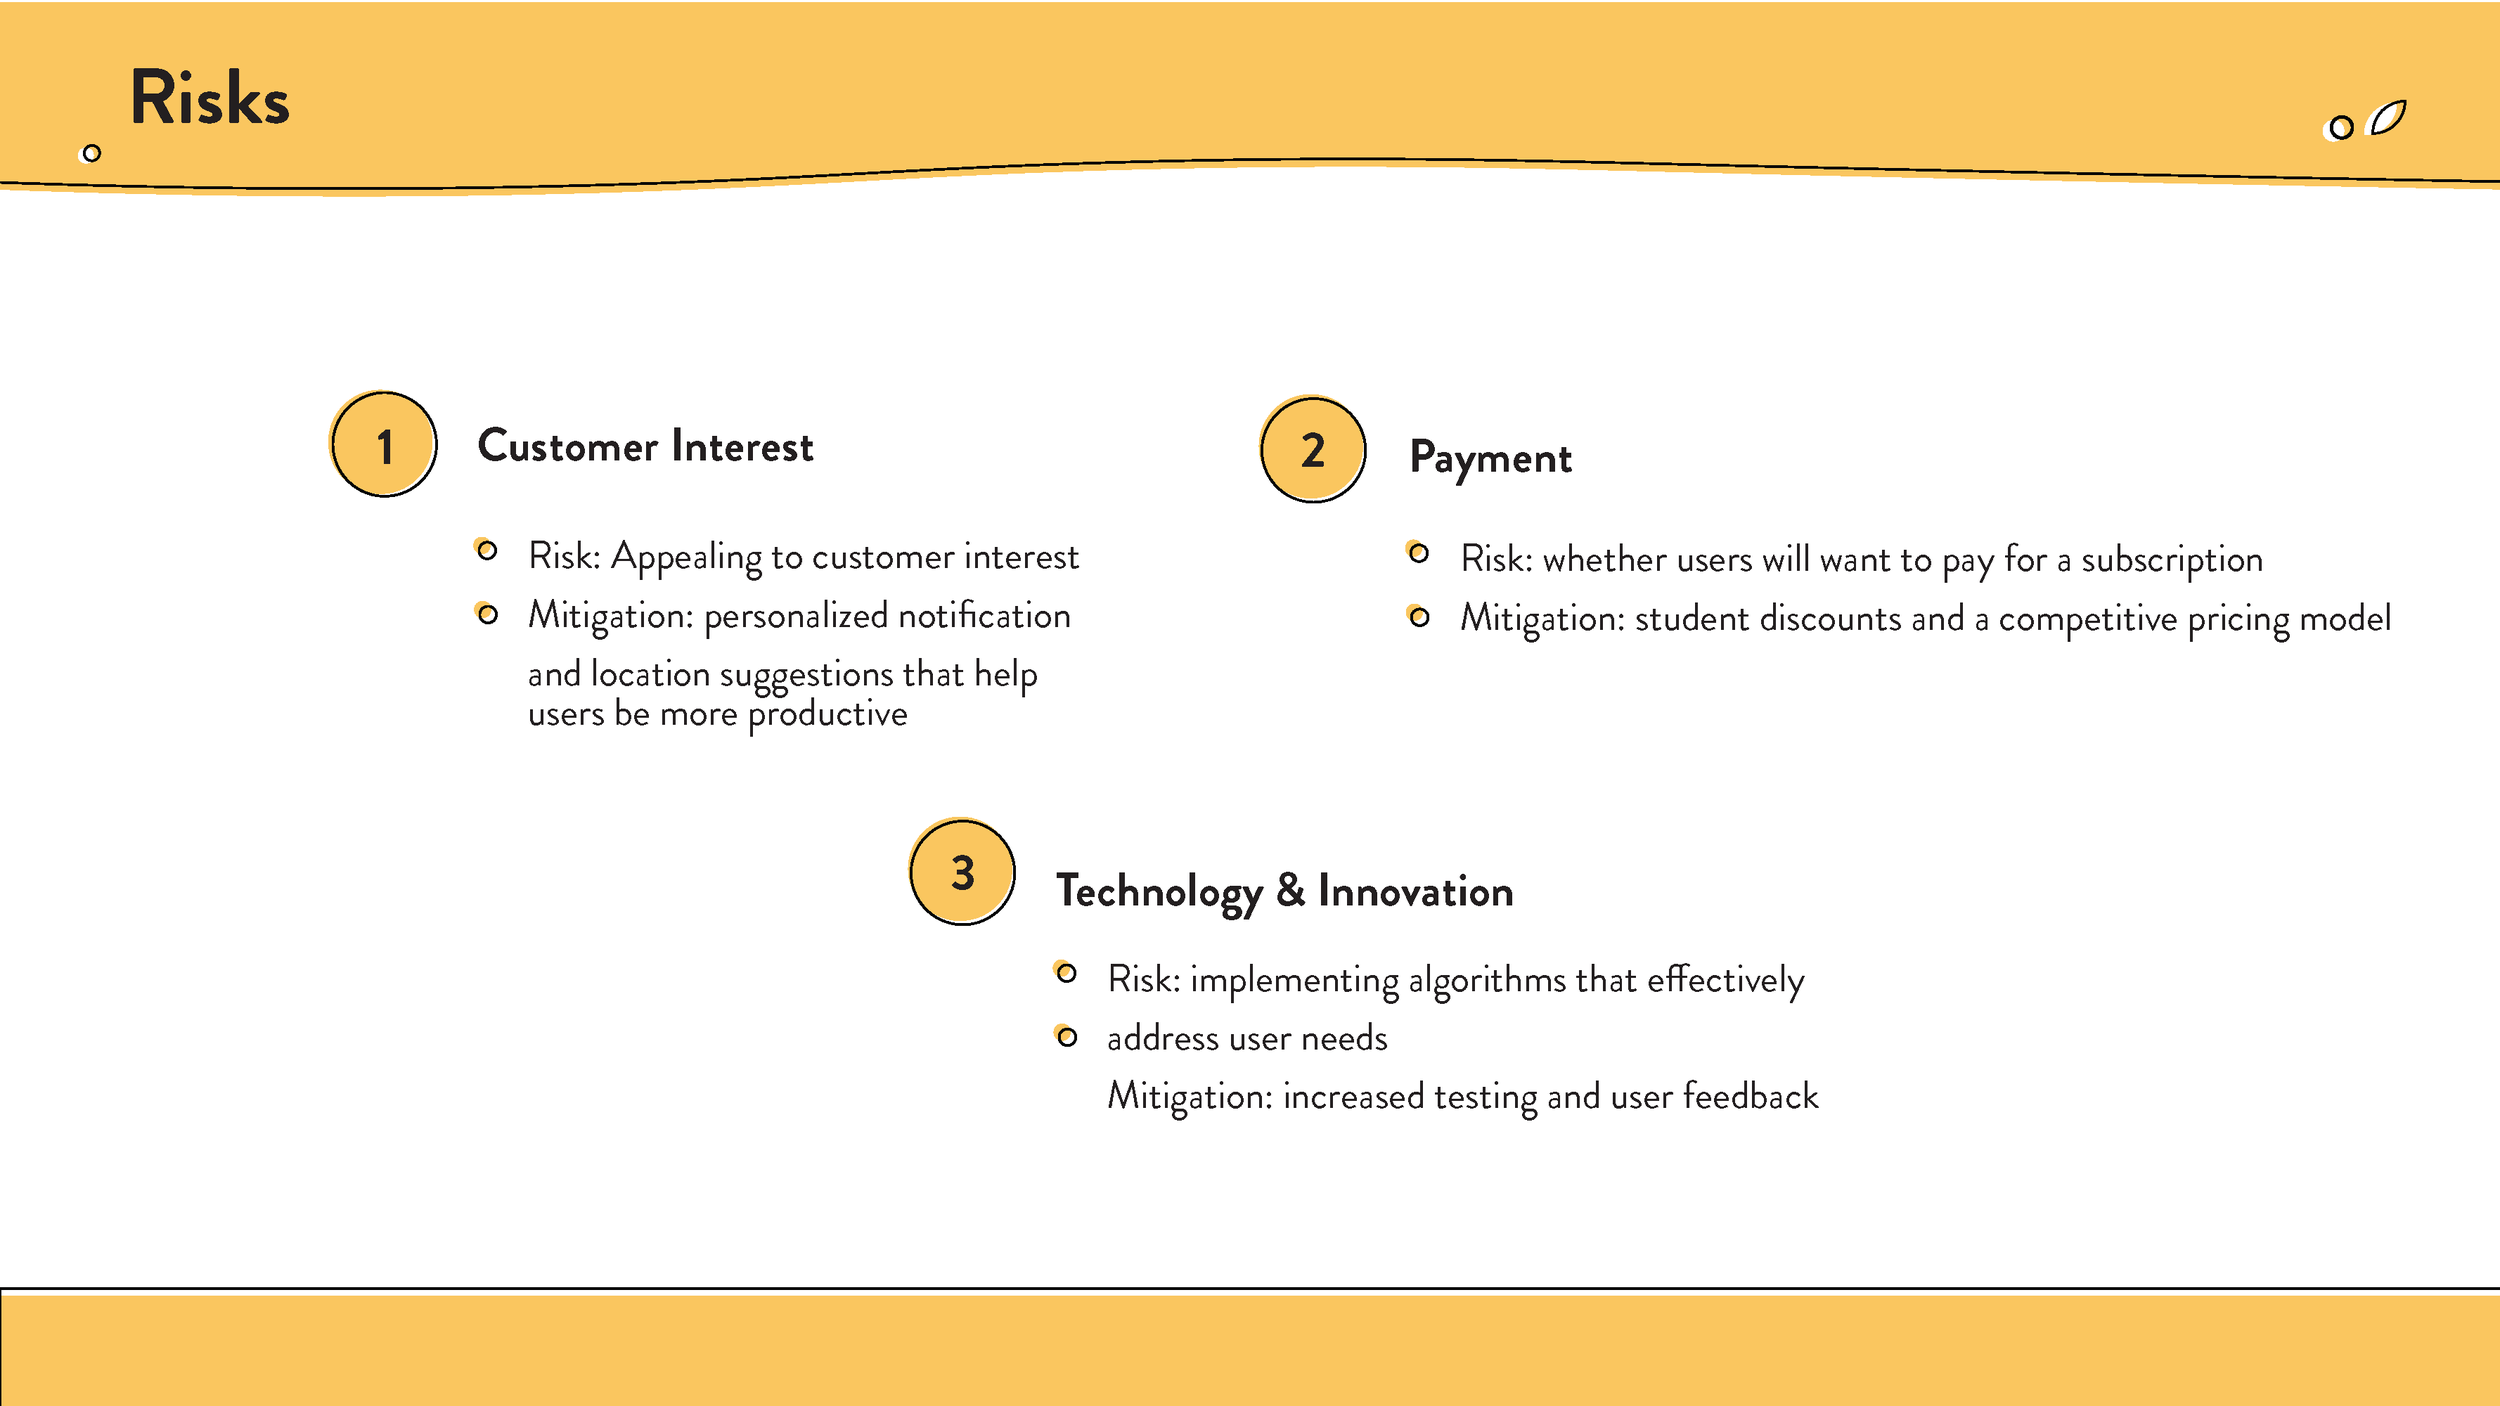
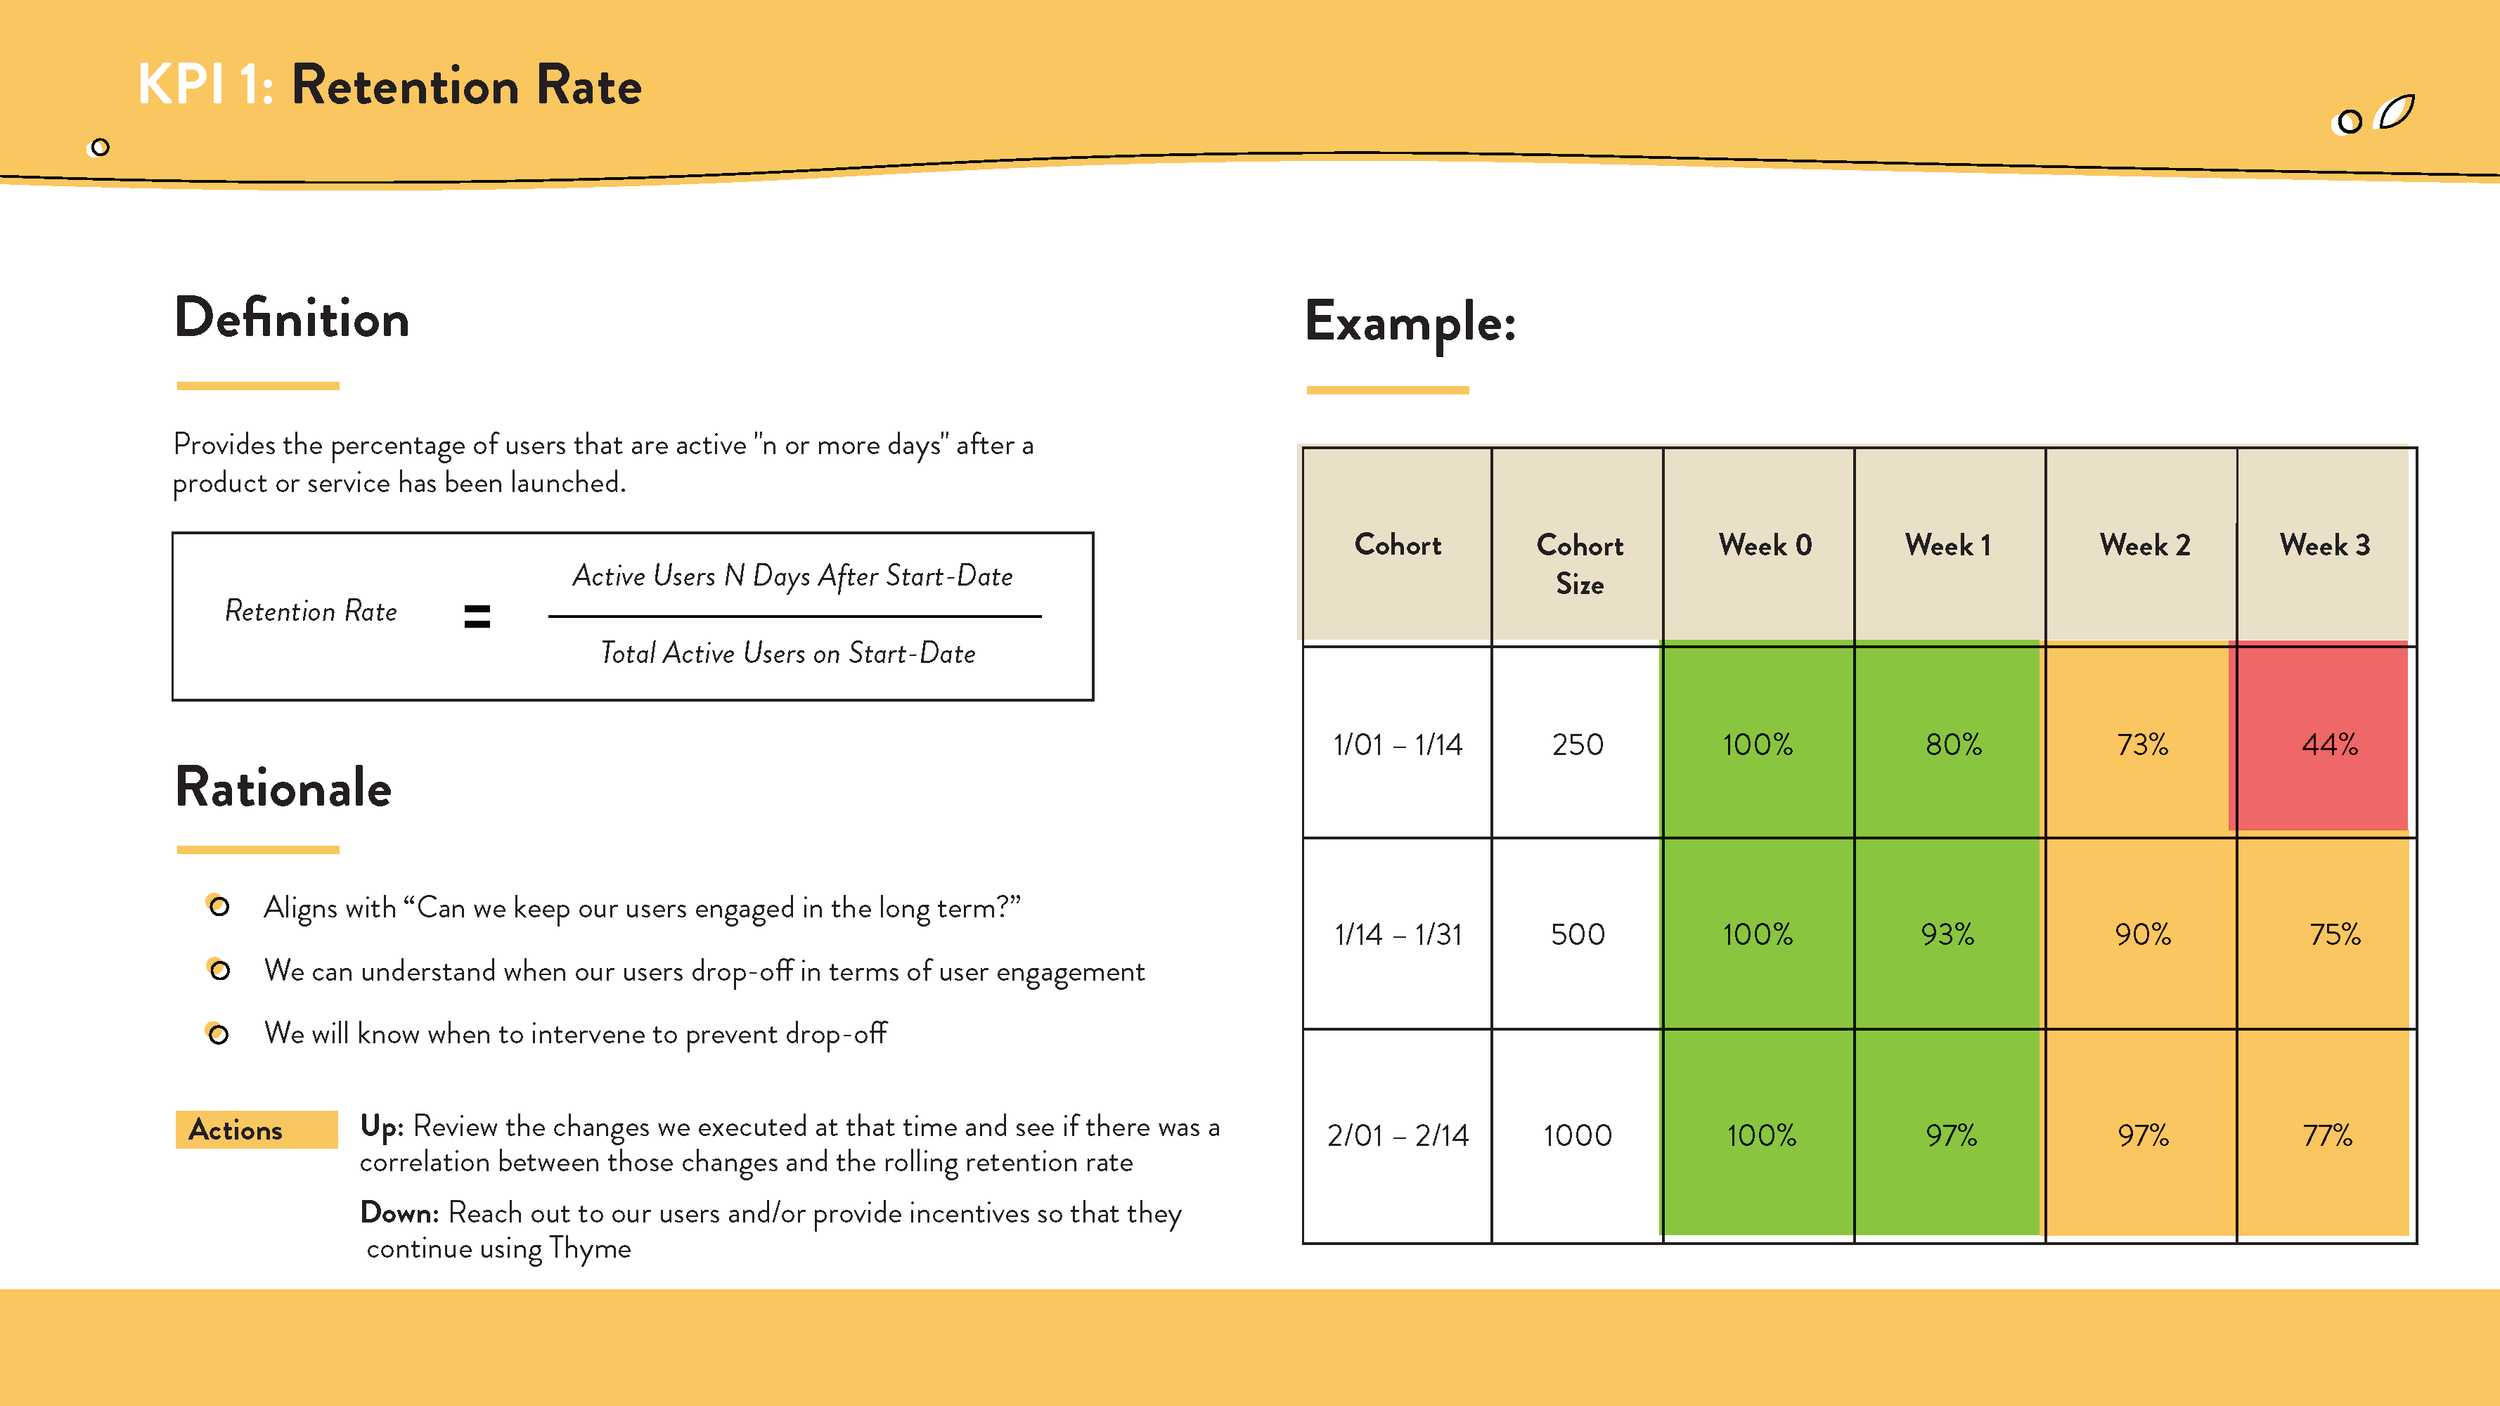
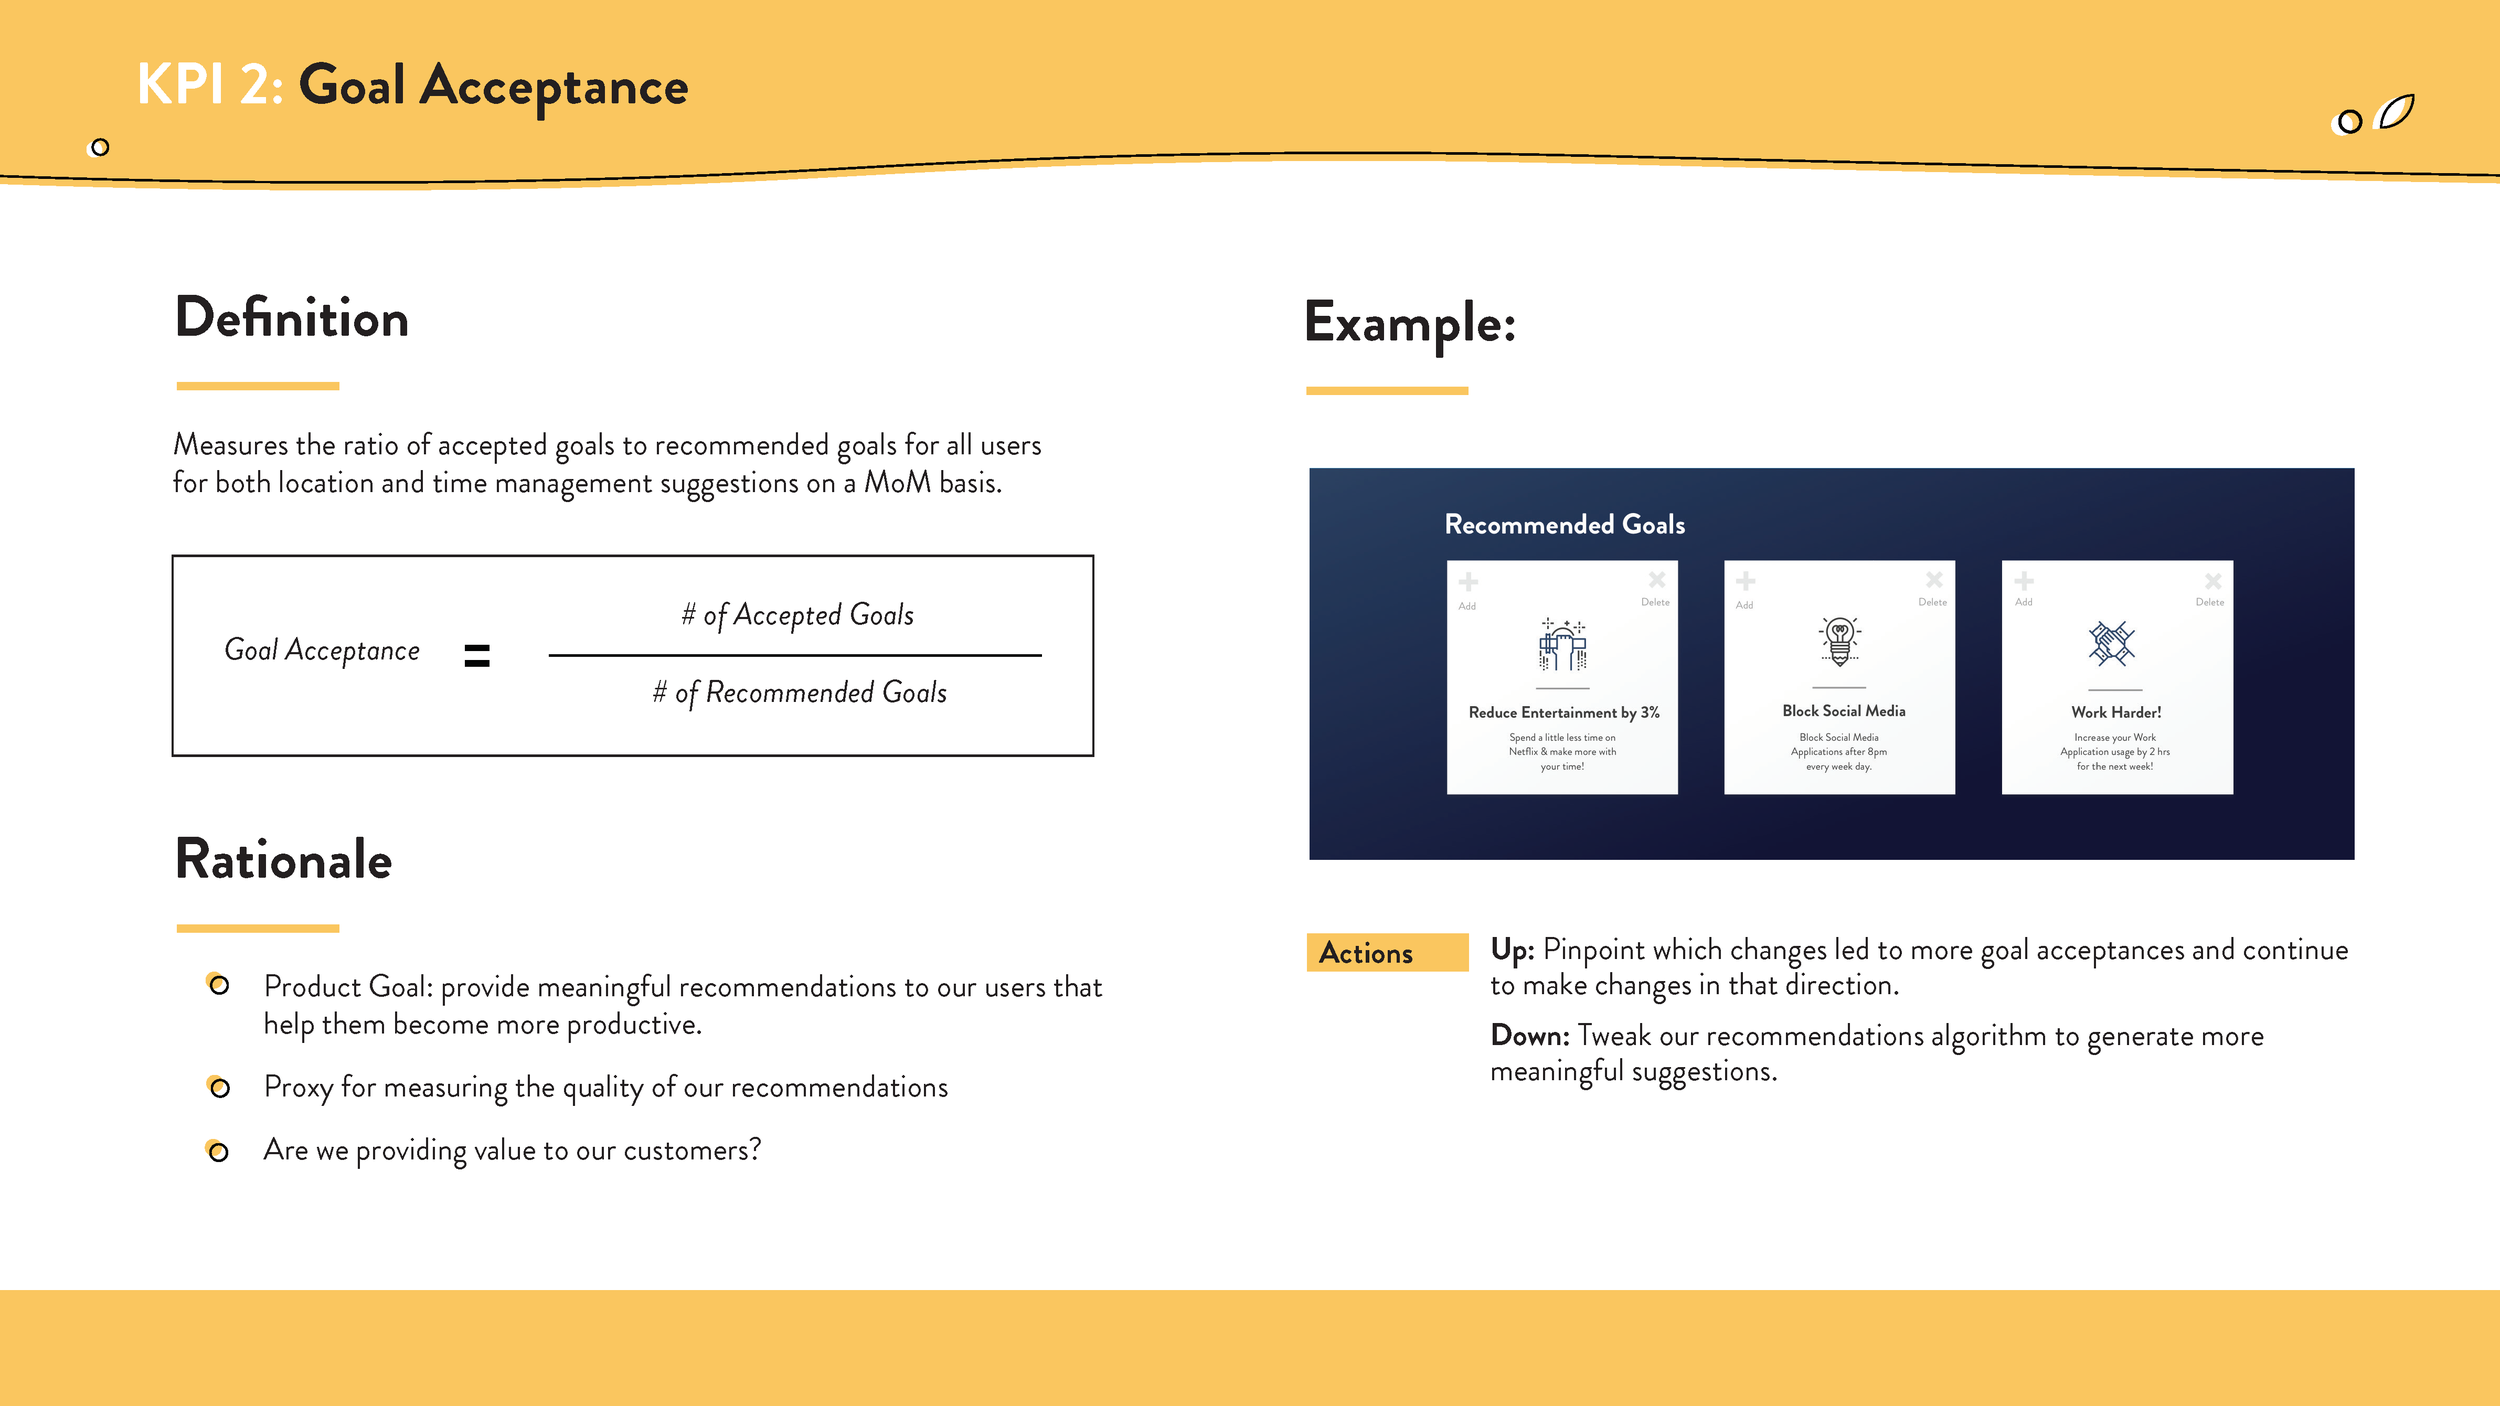
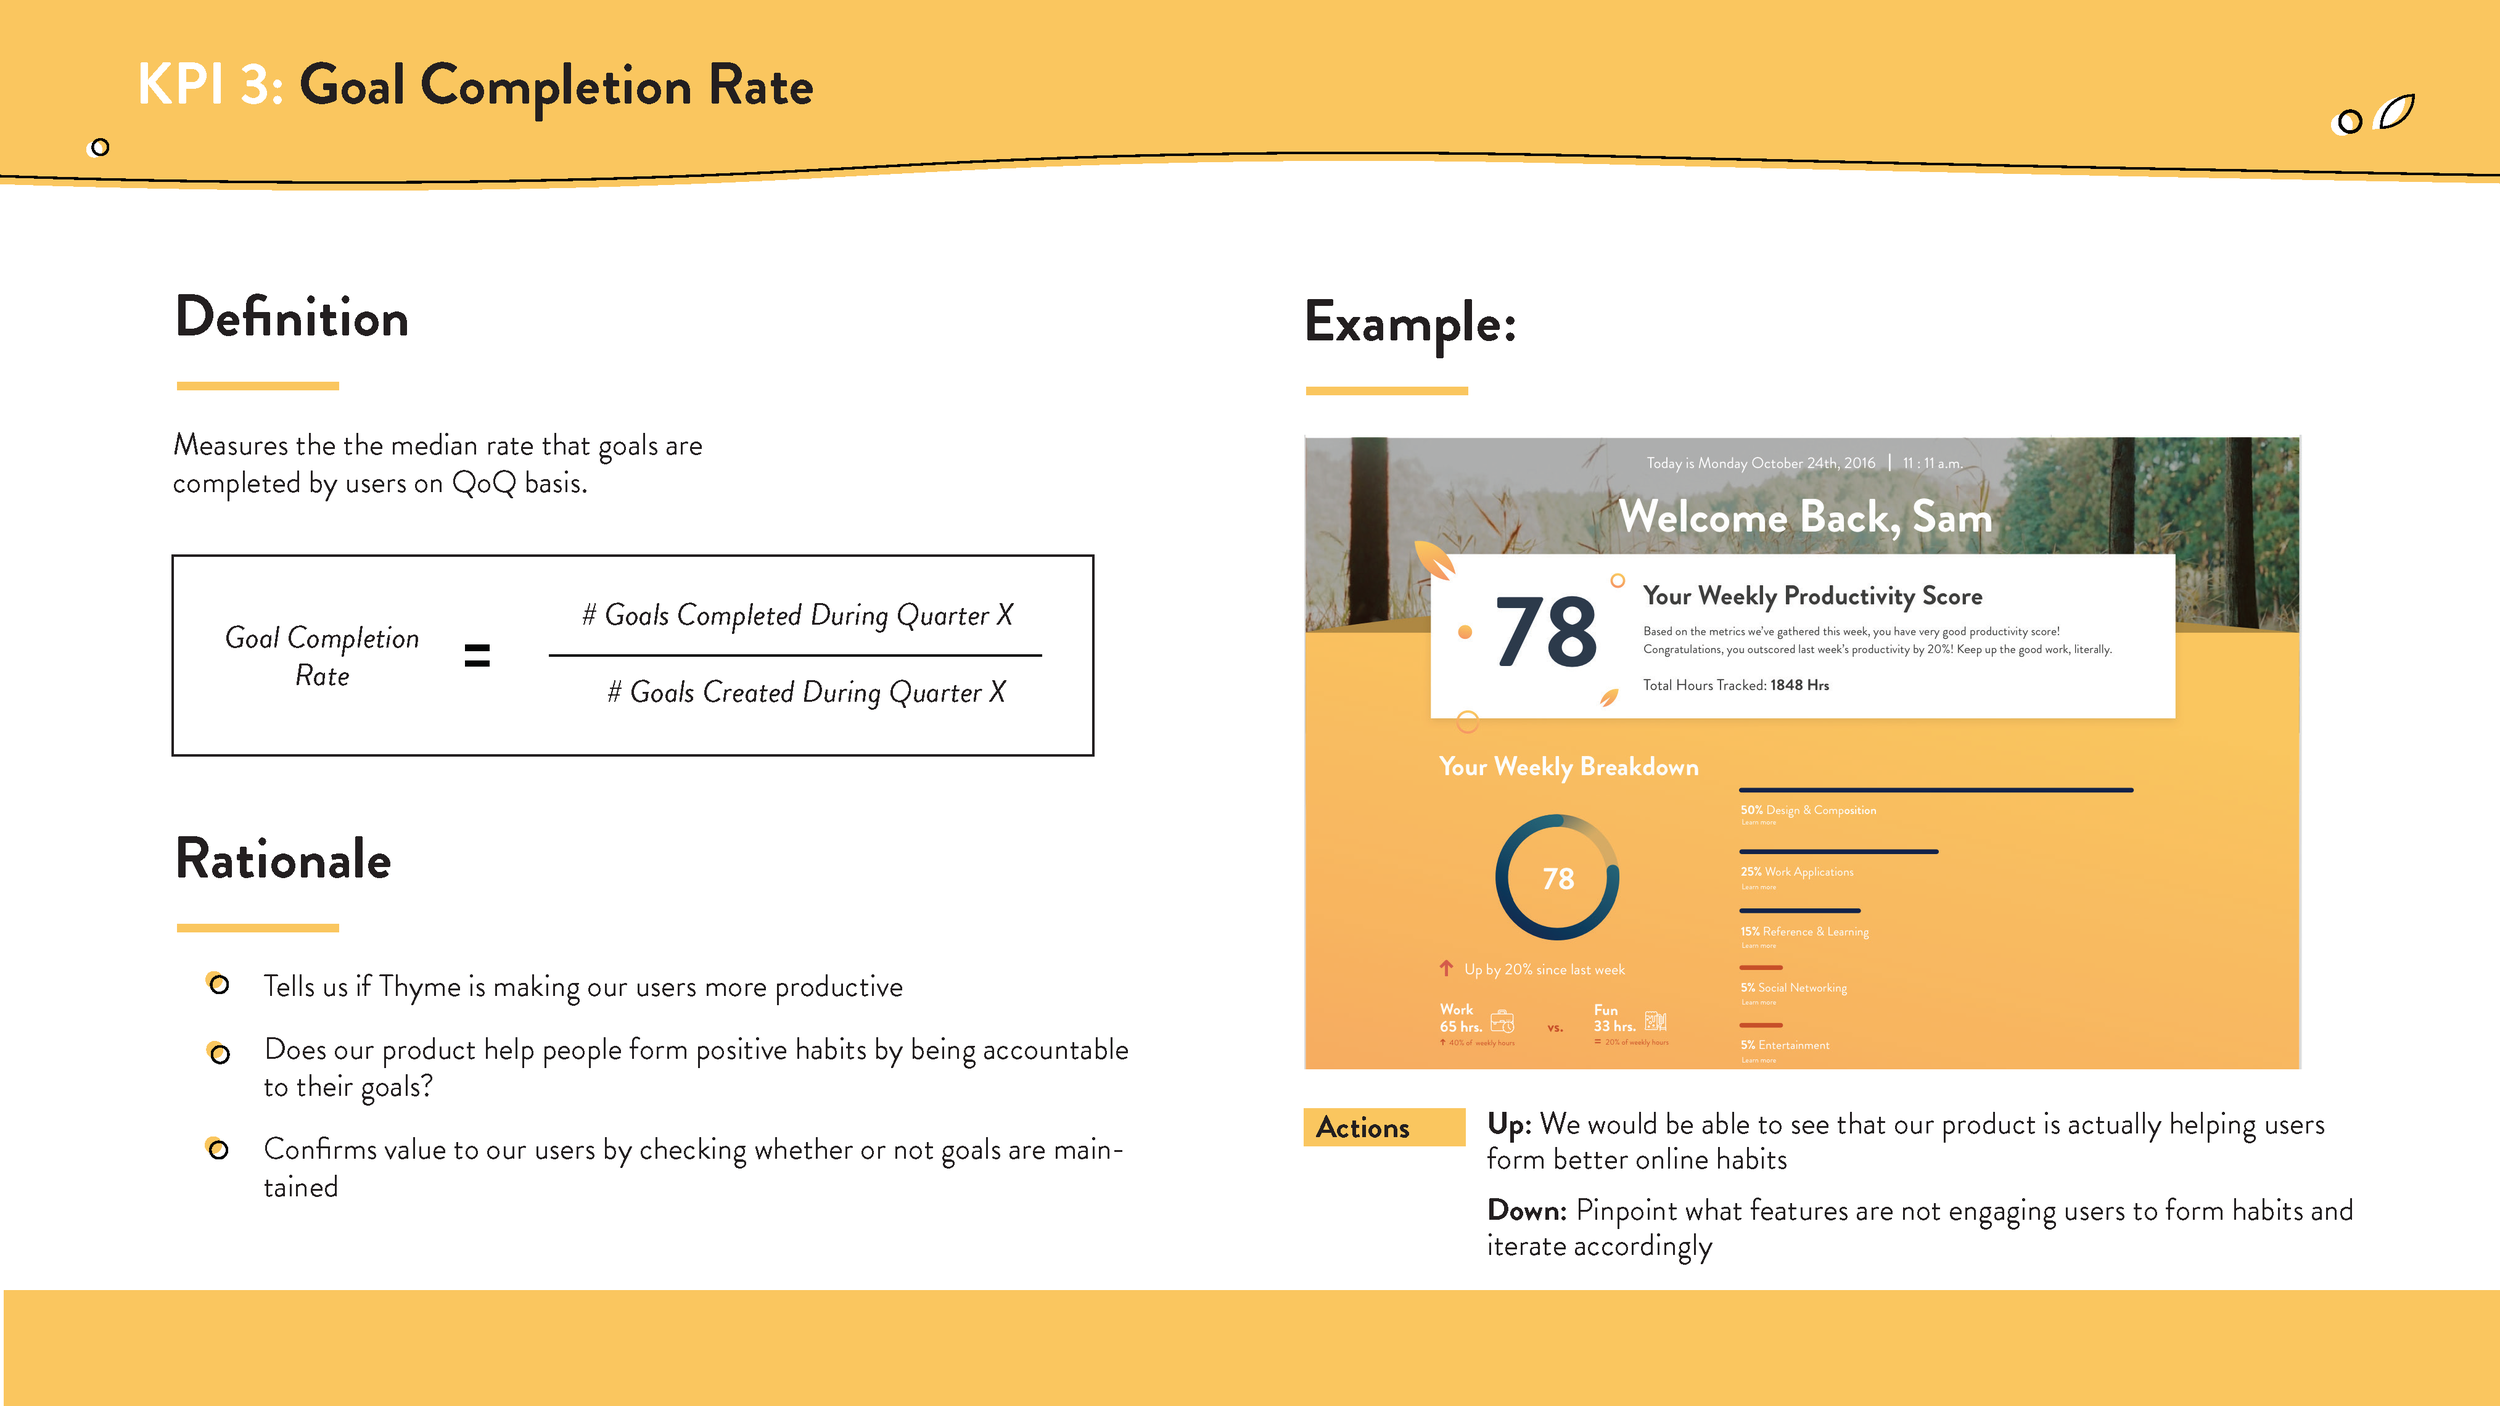
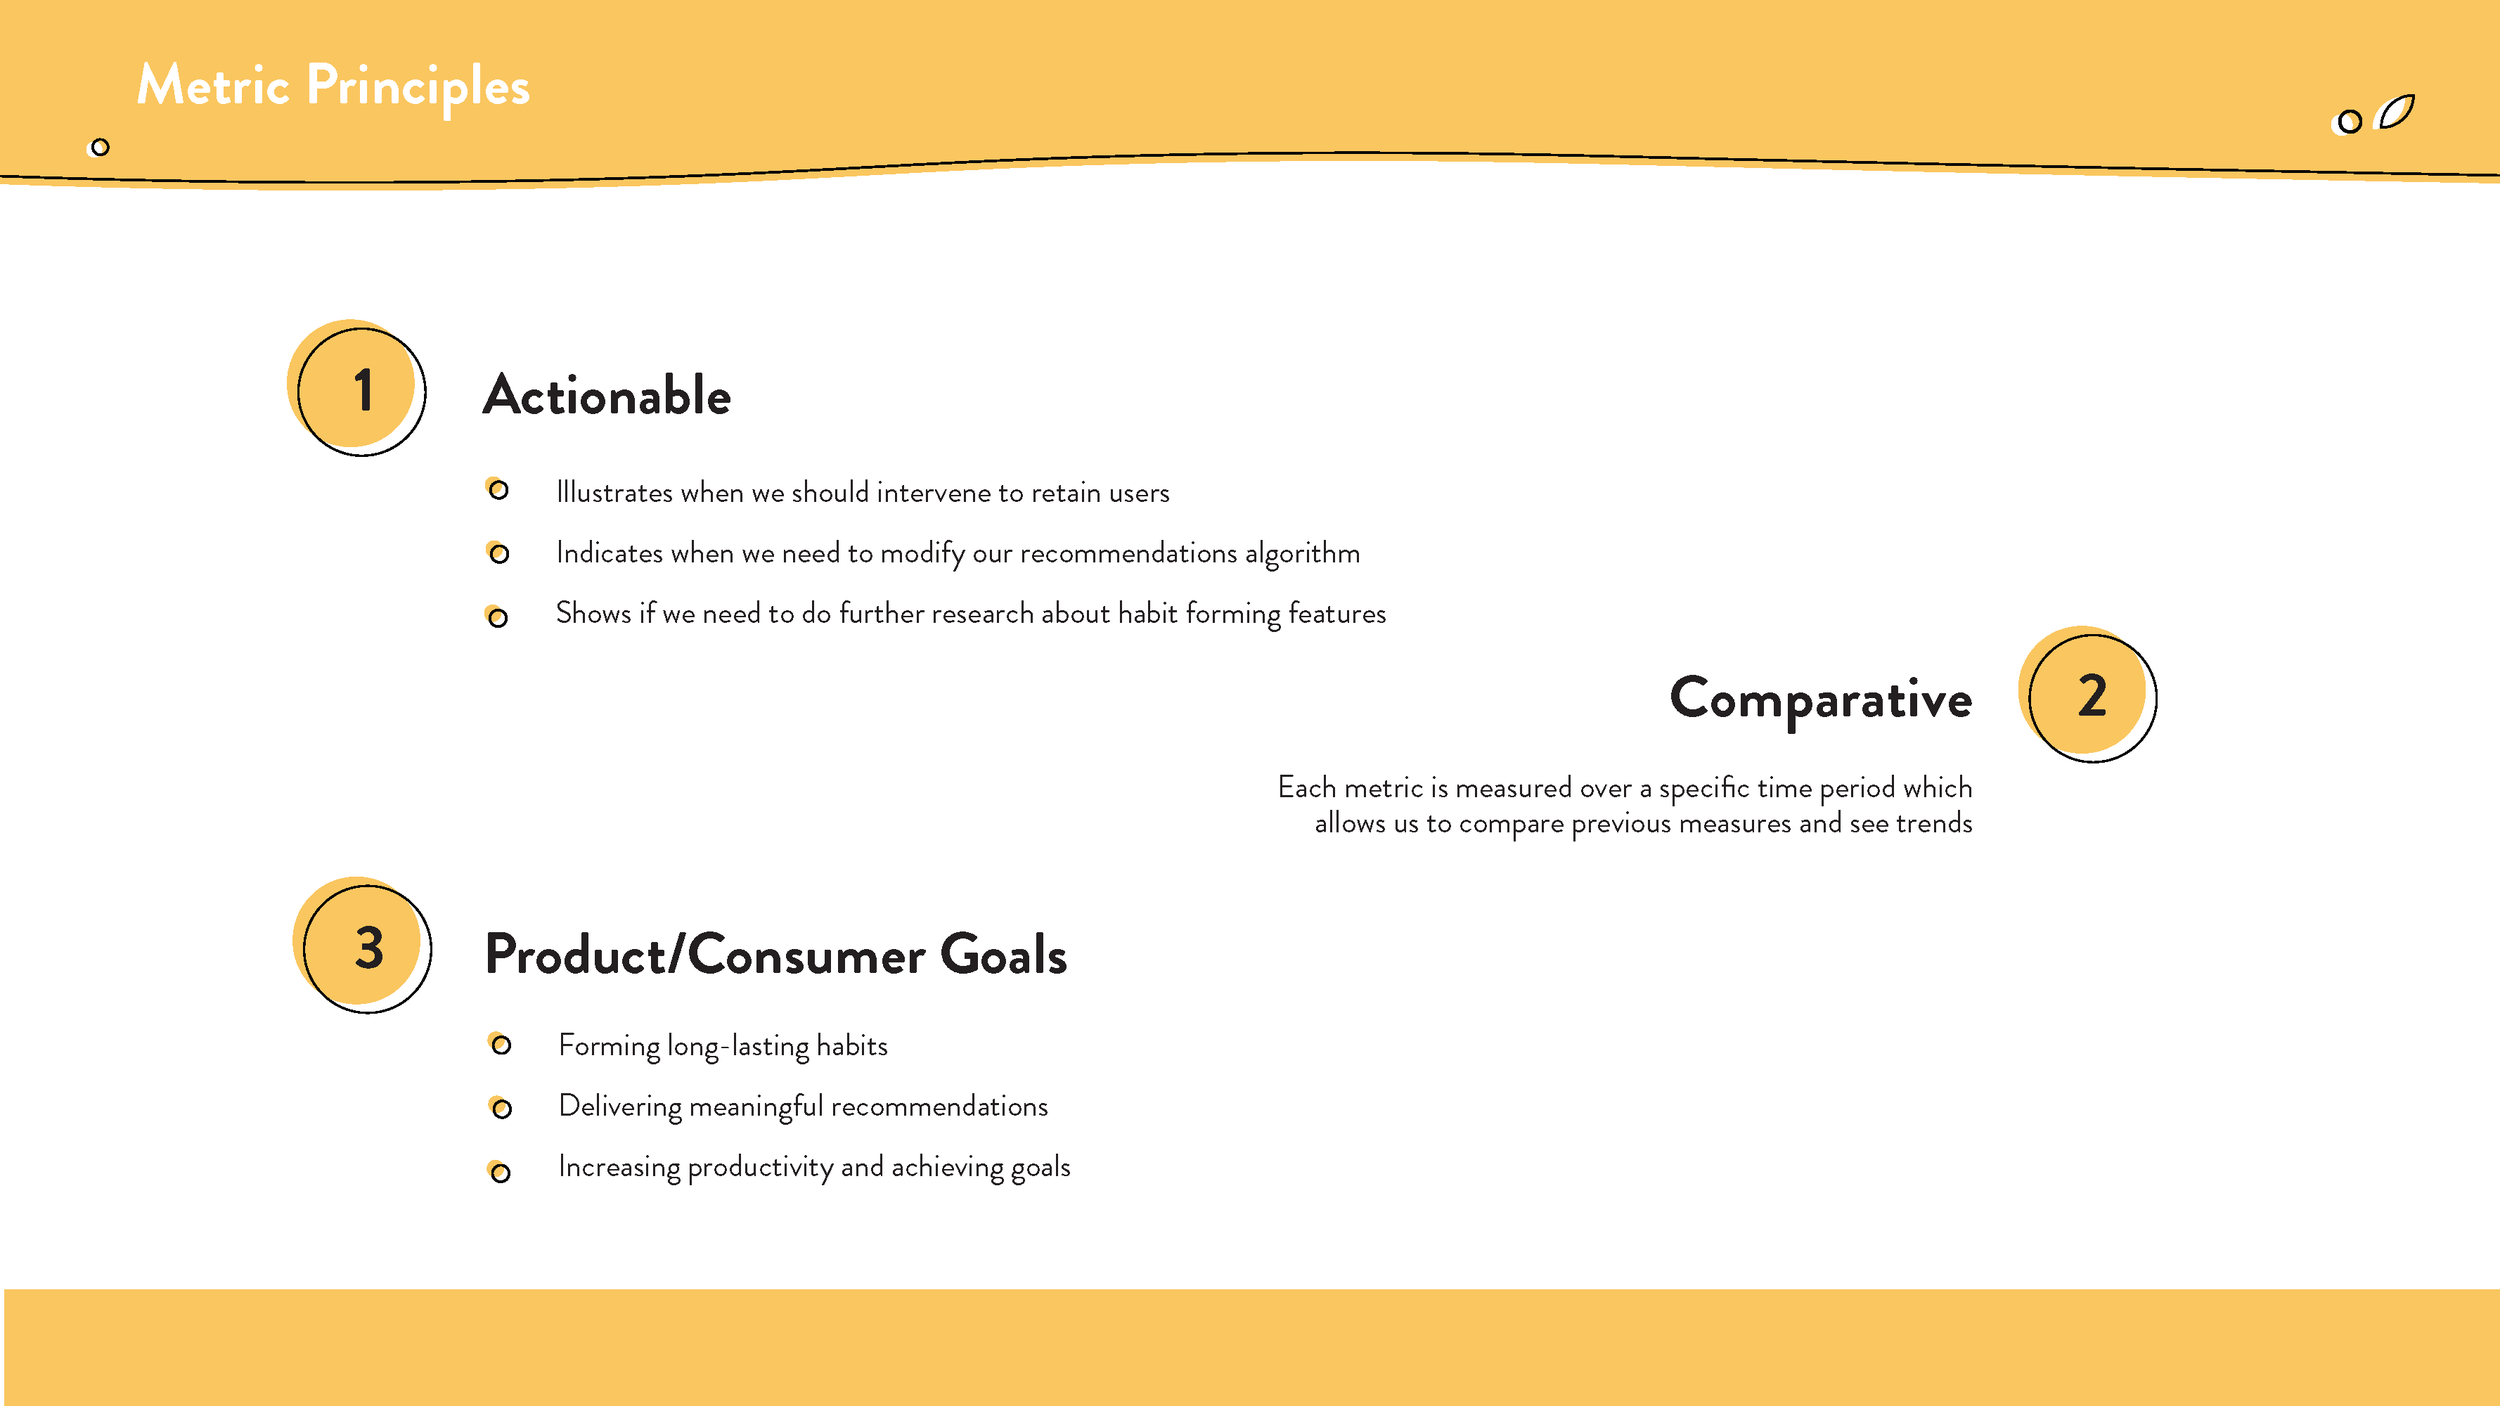
We went through a rigorous process throughout the course of the semester to develop our concept. We aimed at fulfilling both business goals by creating a viable business model, KPI's to evaluate the MVP, & navigating the competitive market.
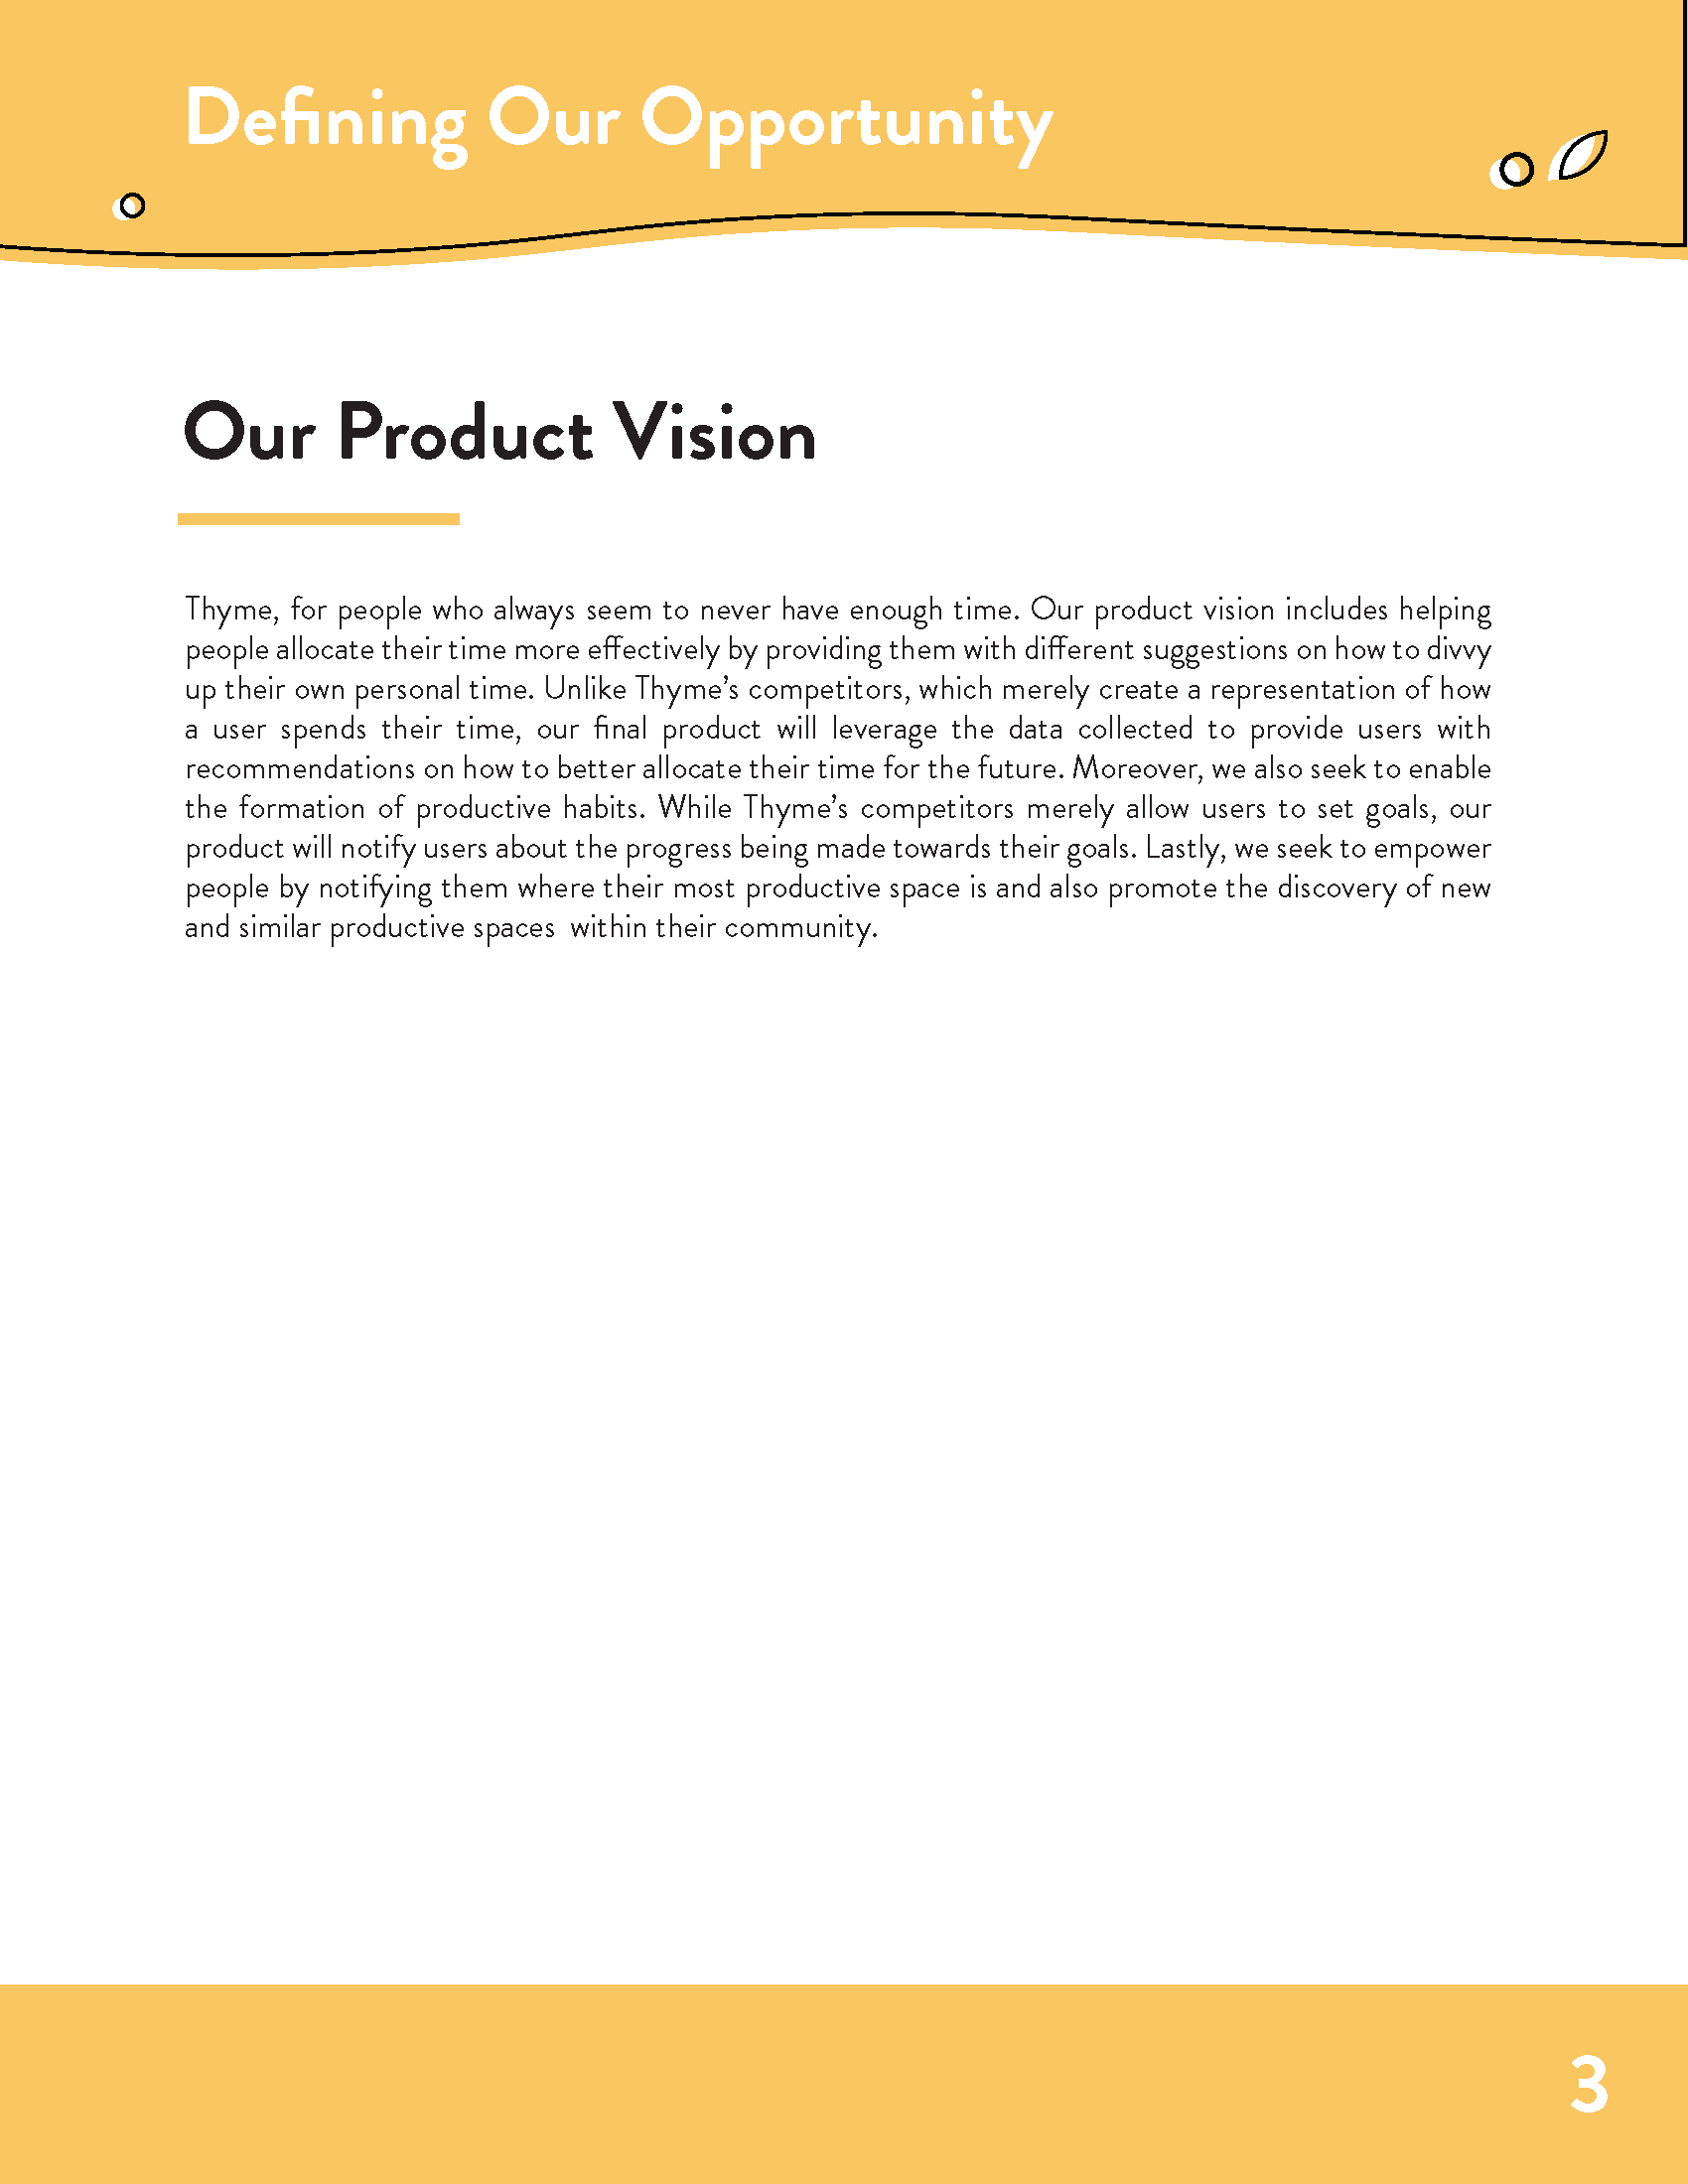
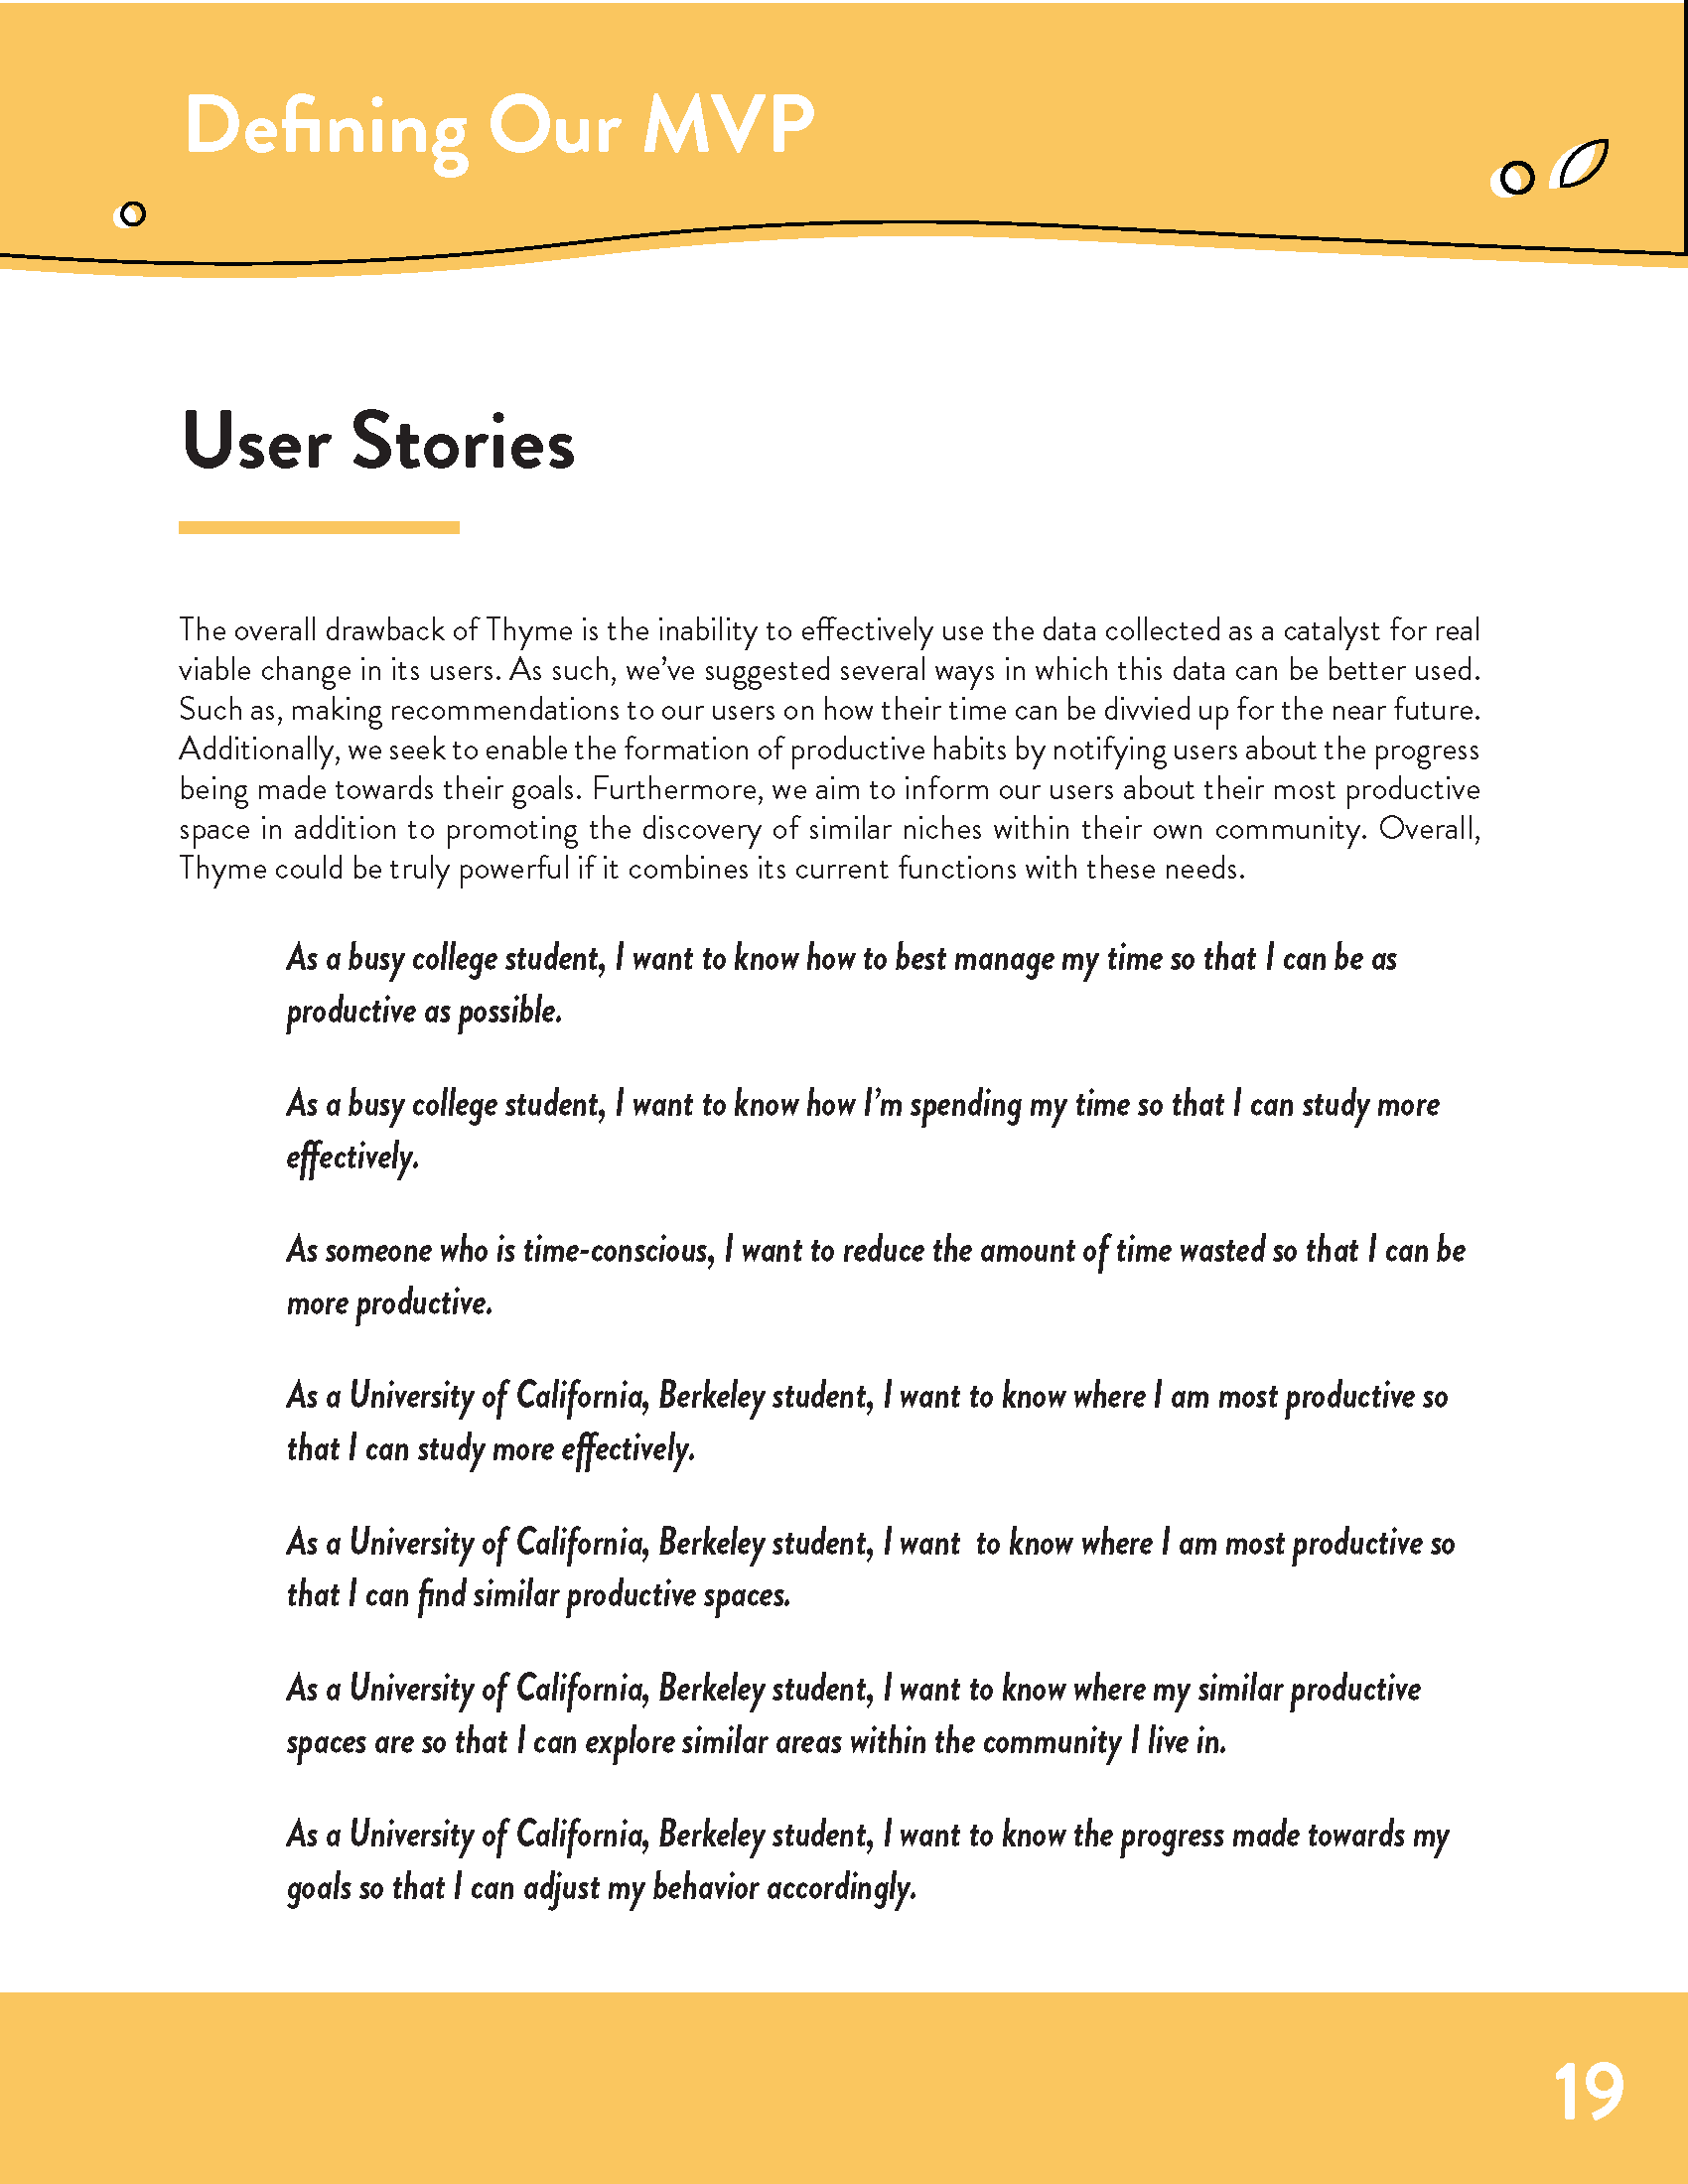
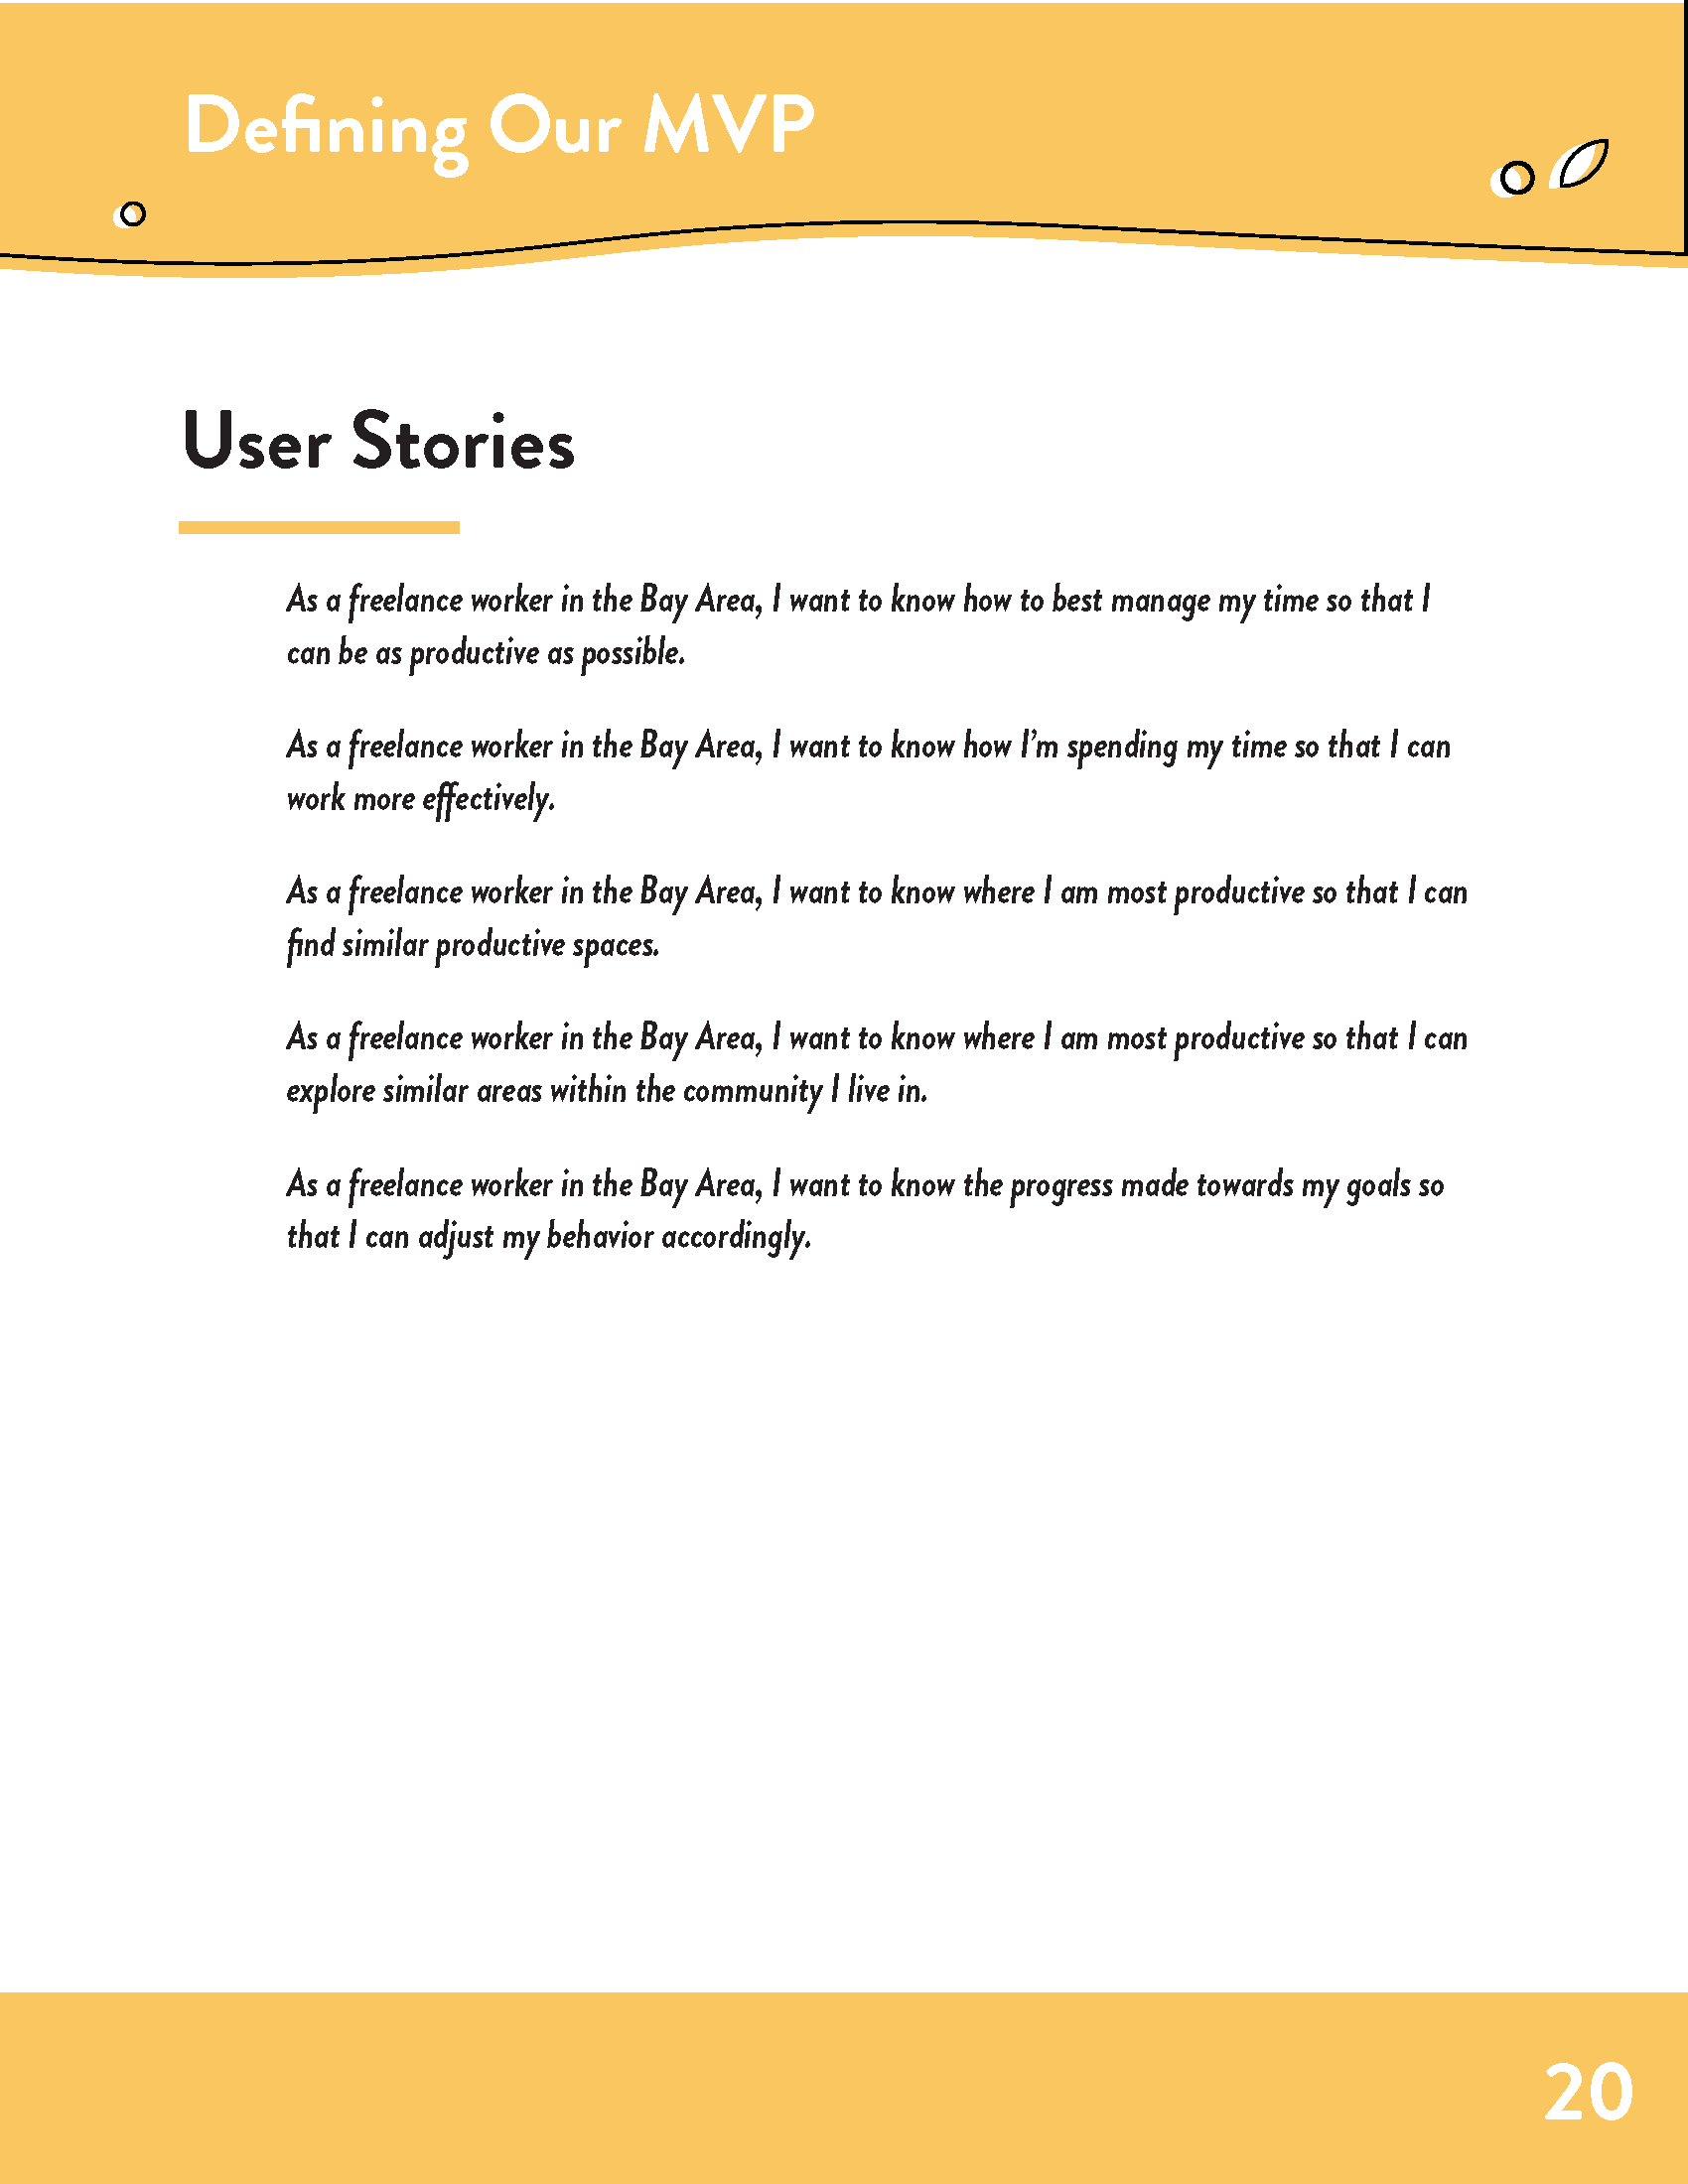
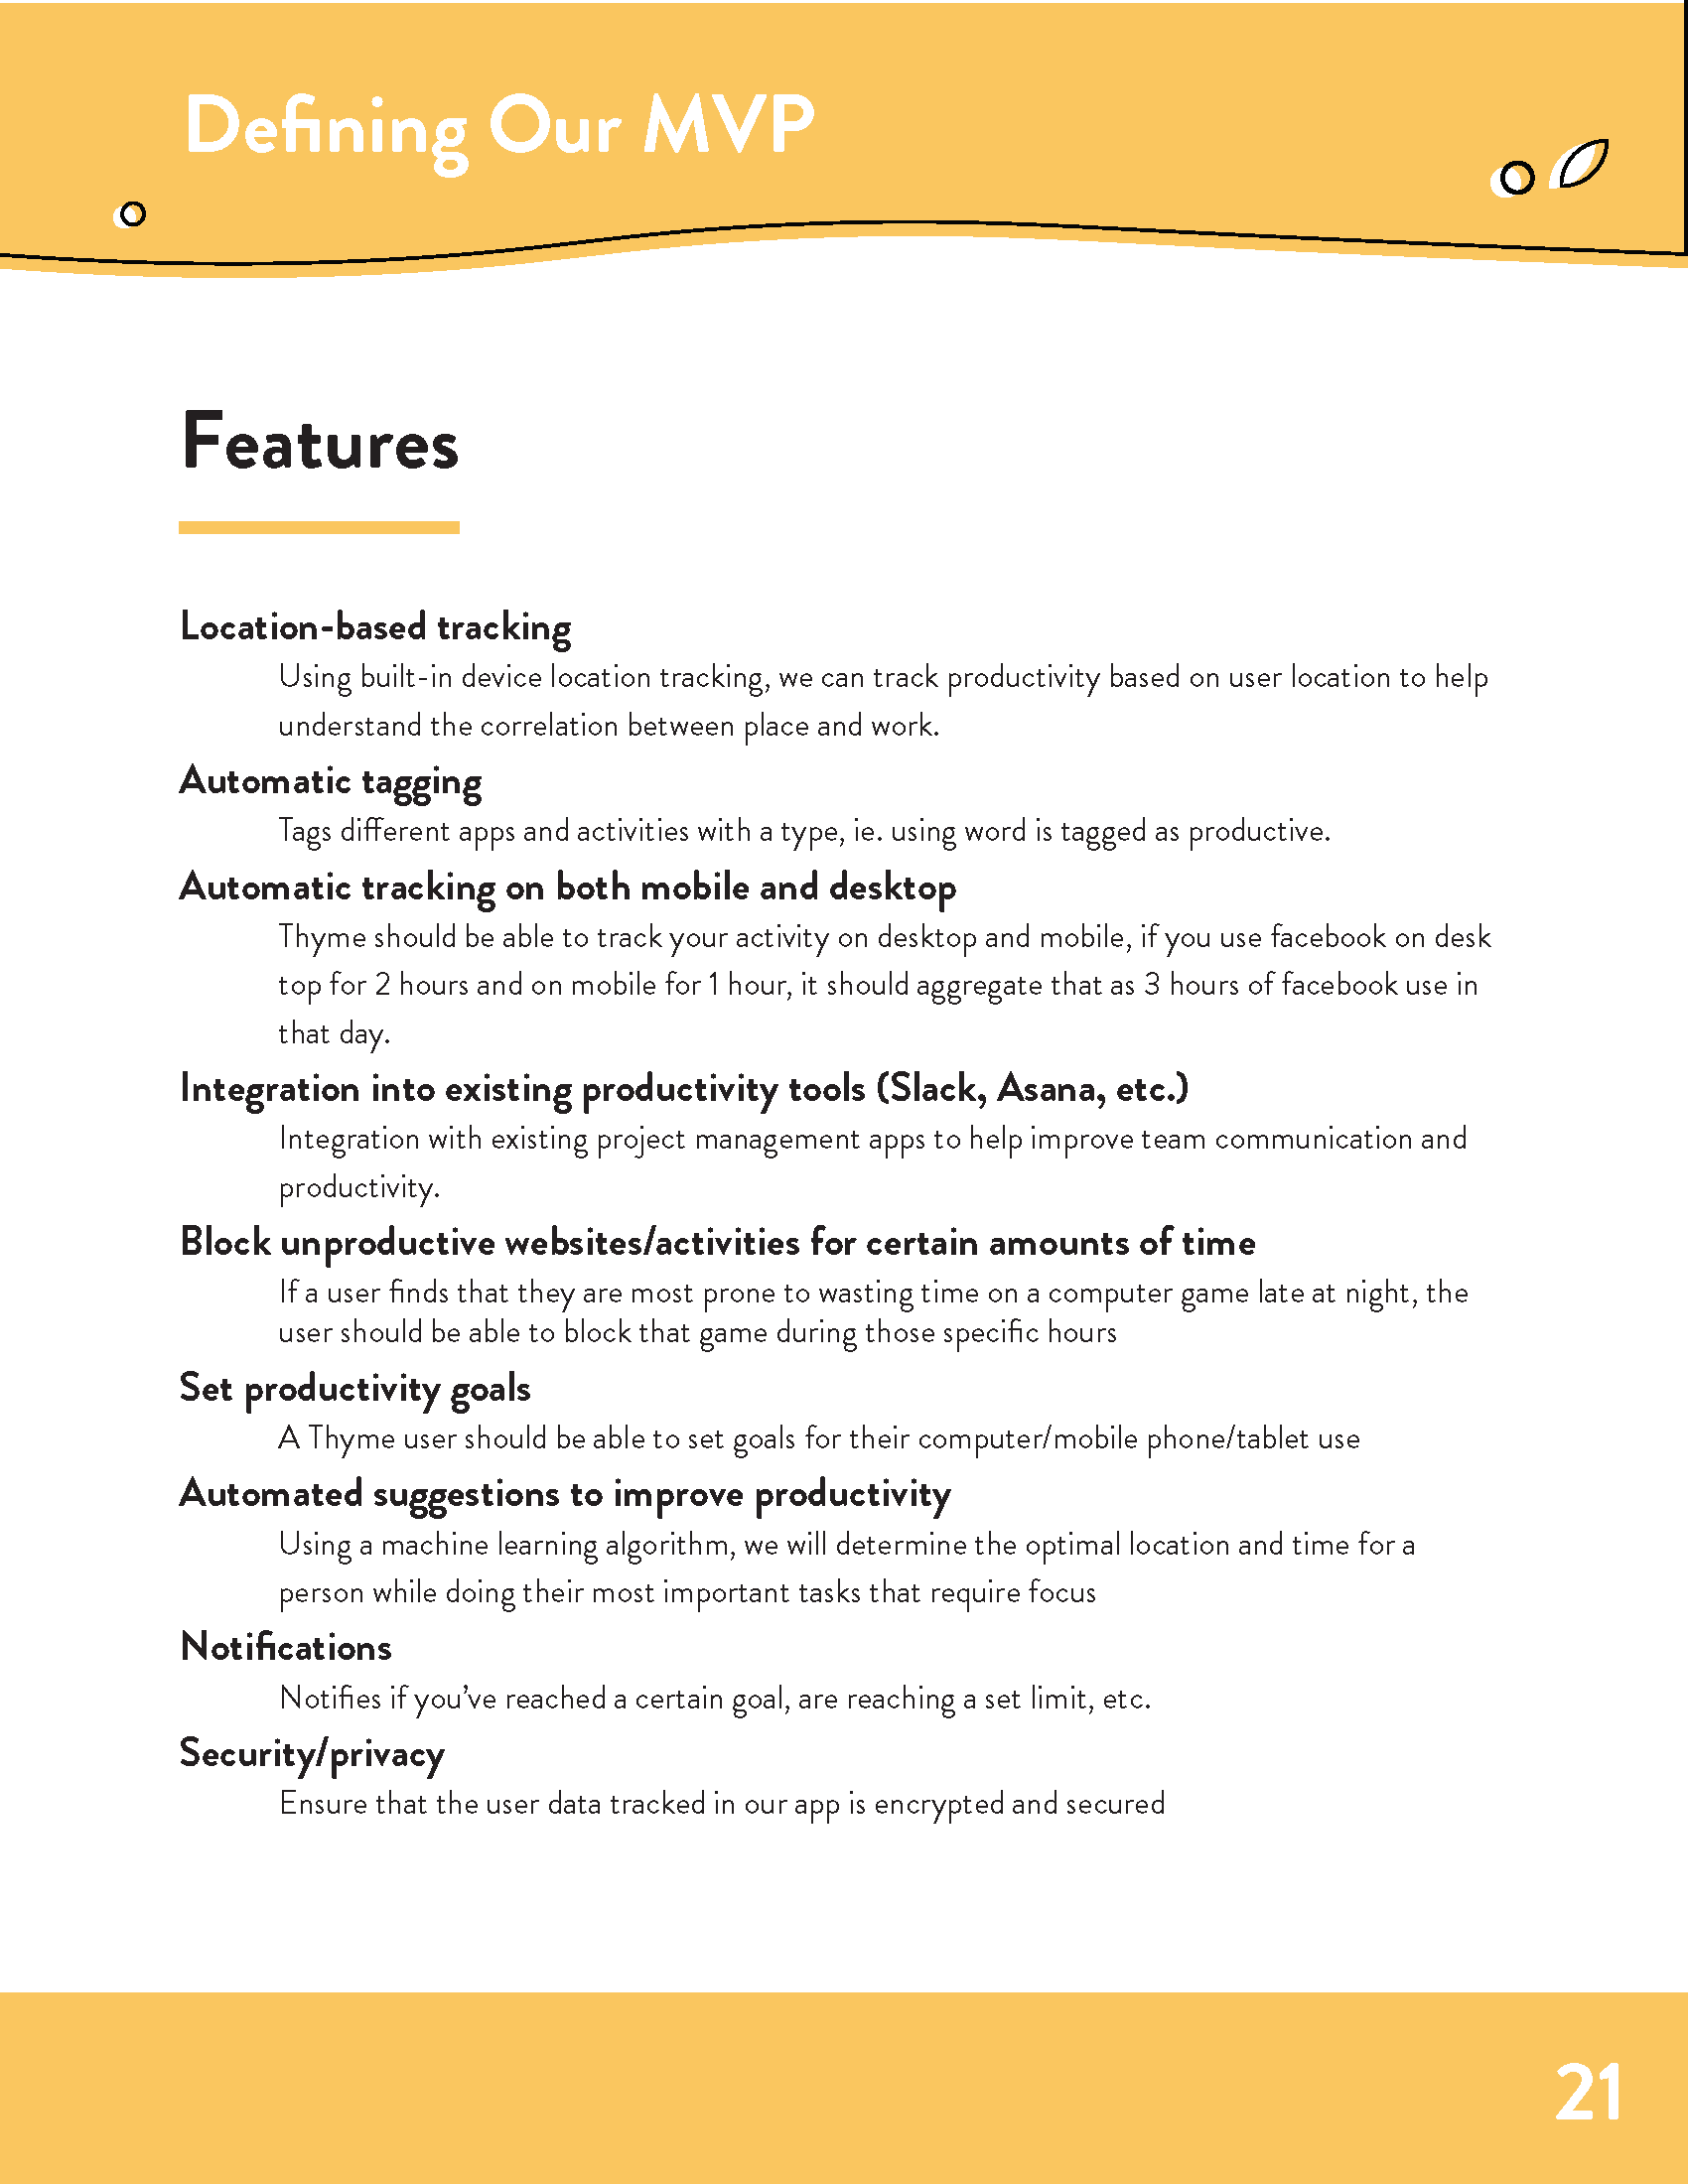
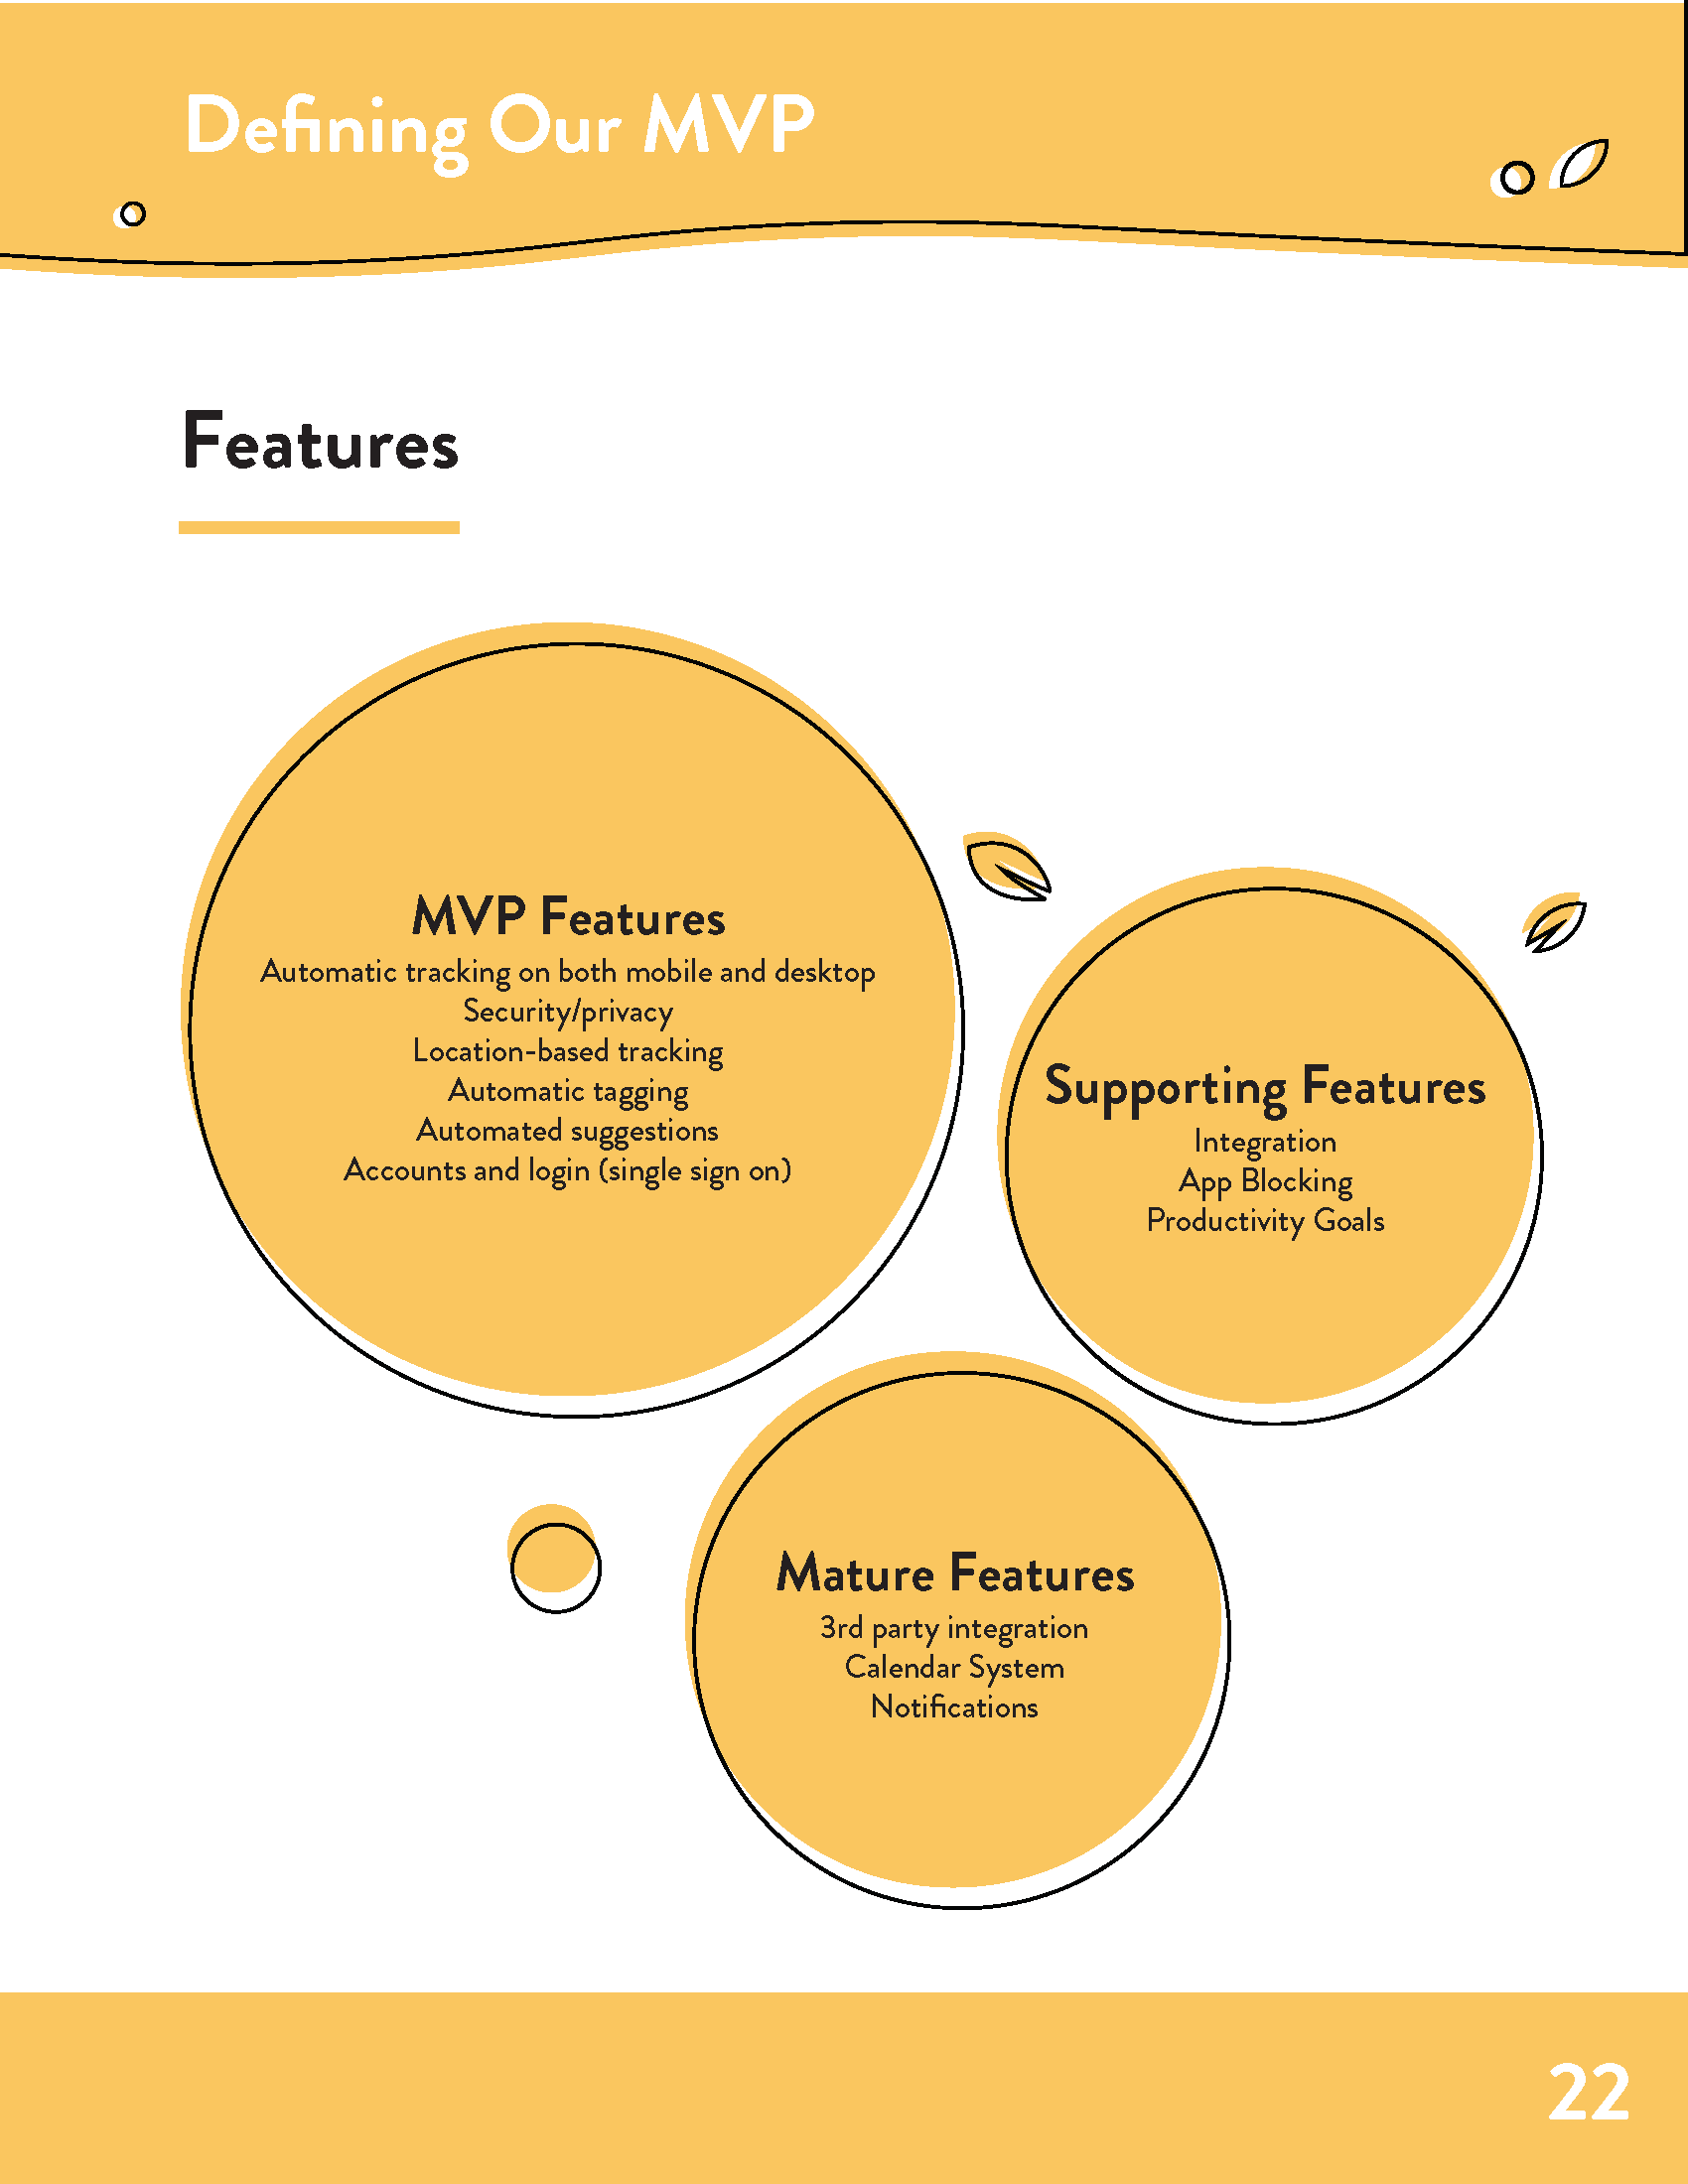
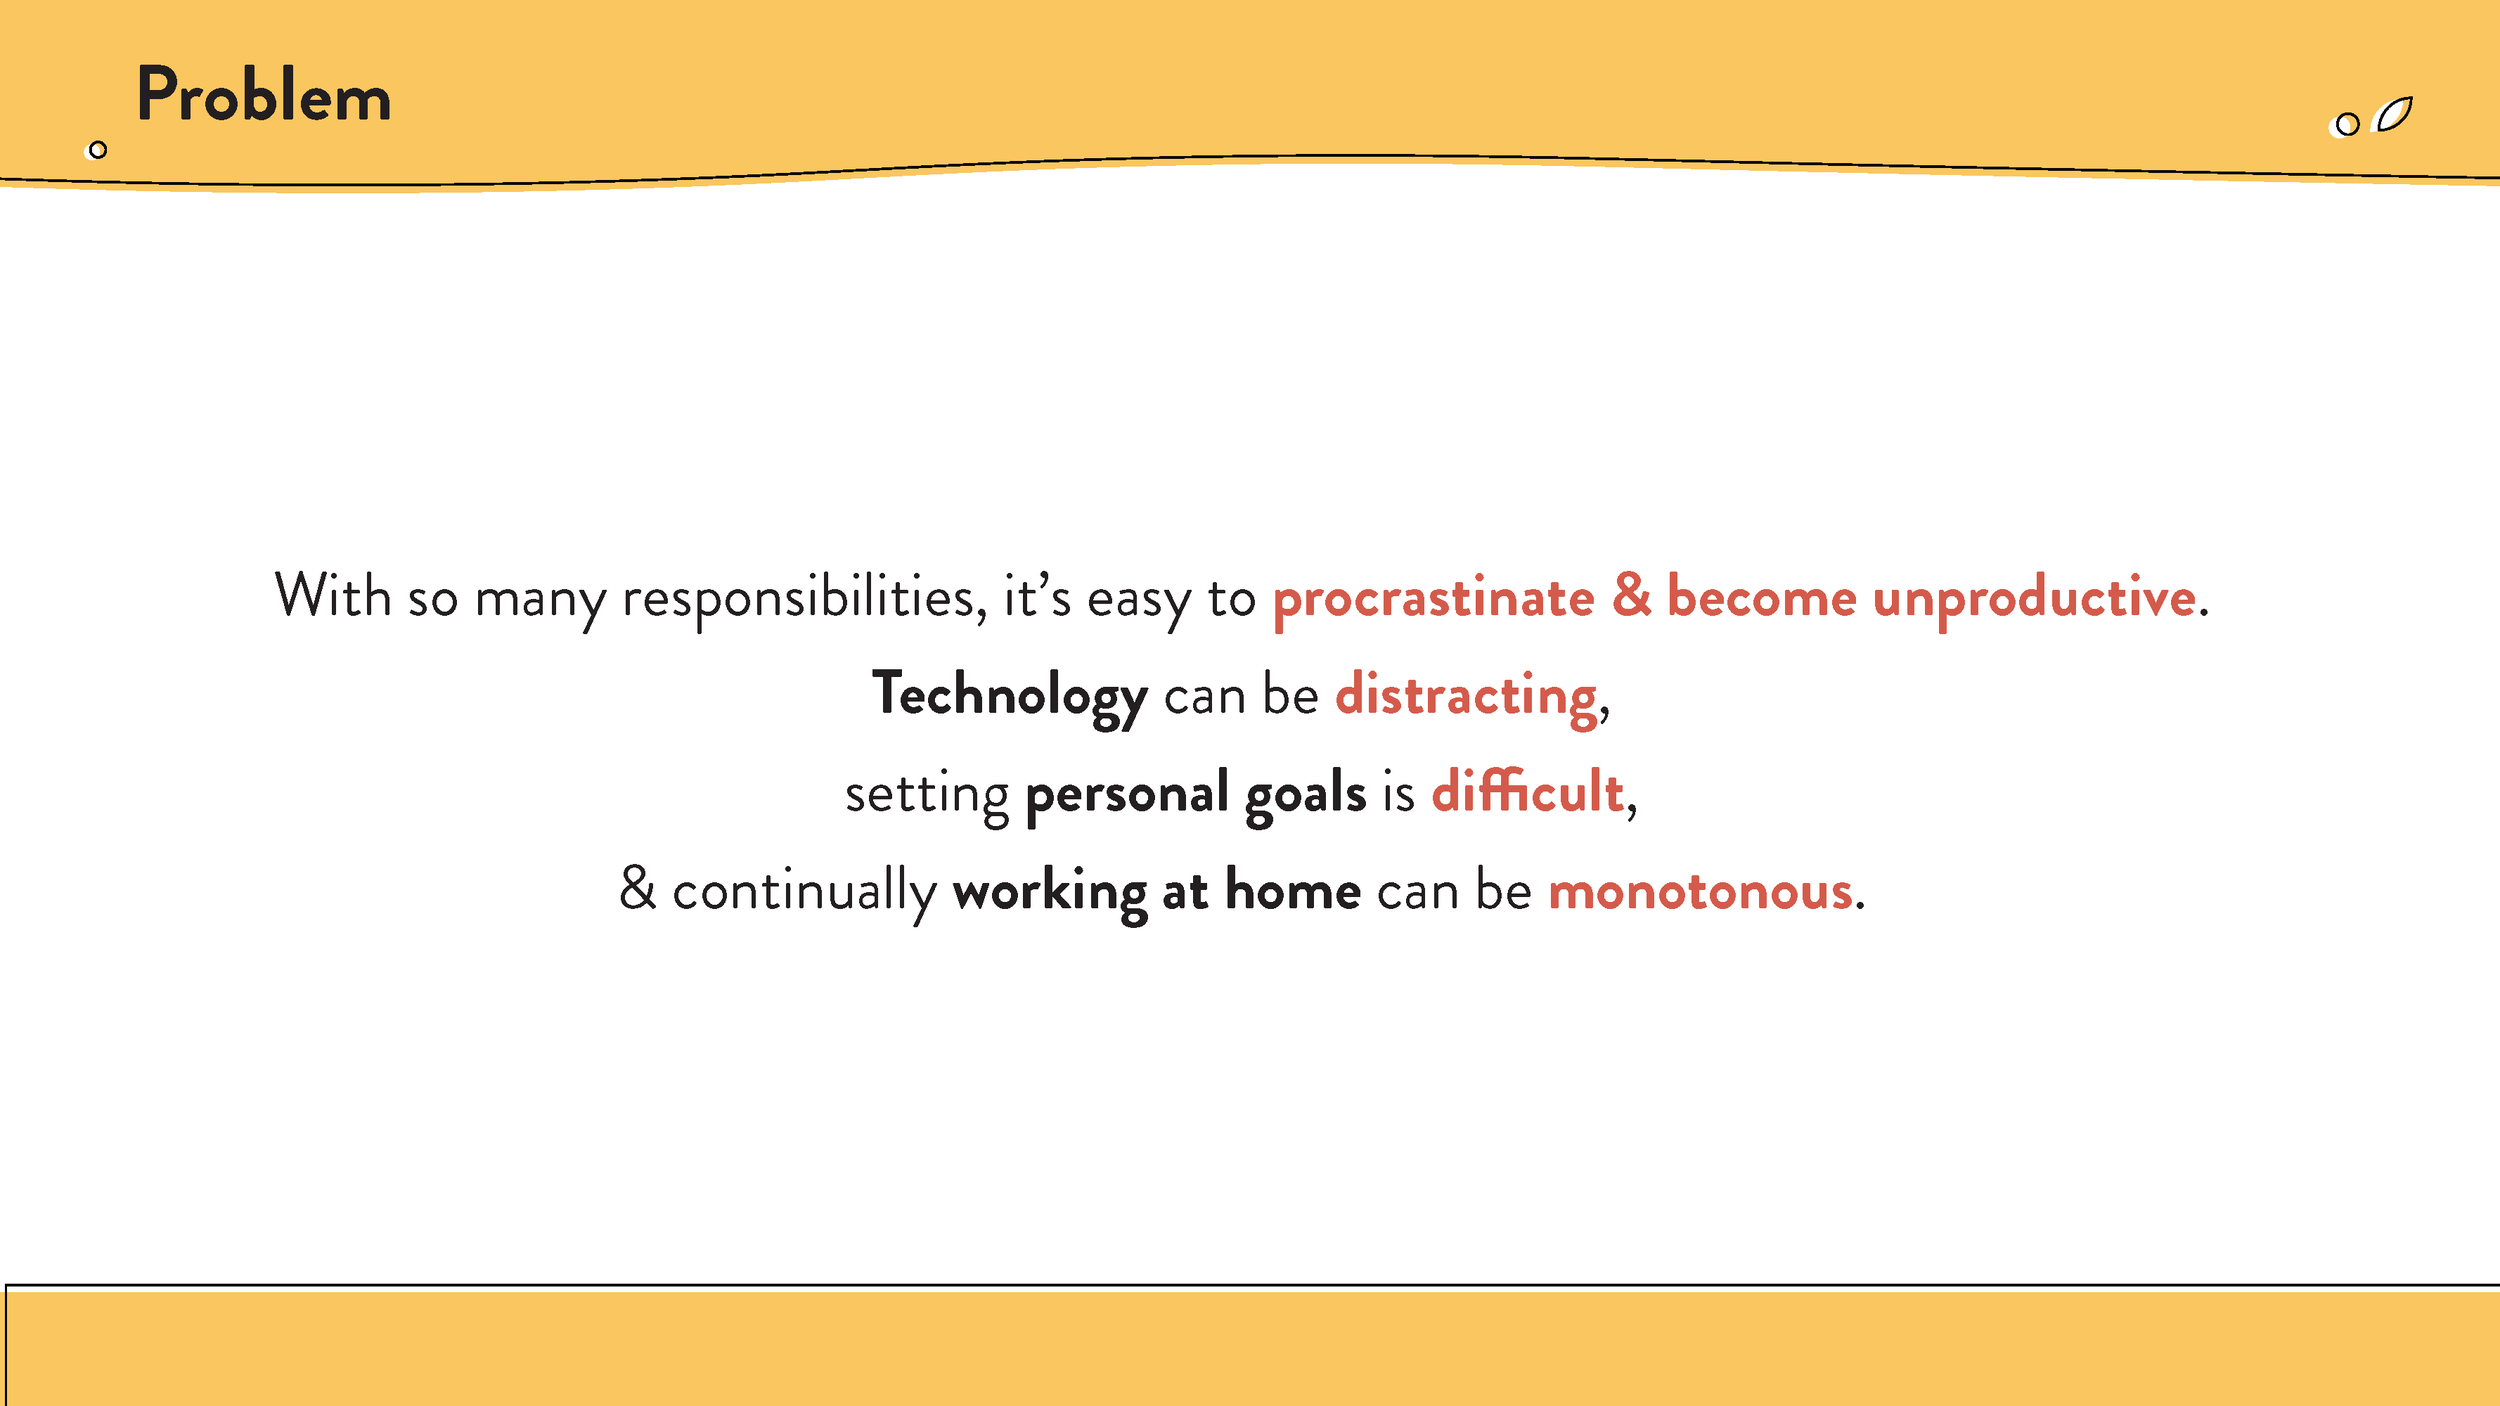
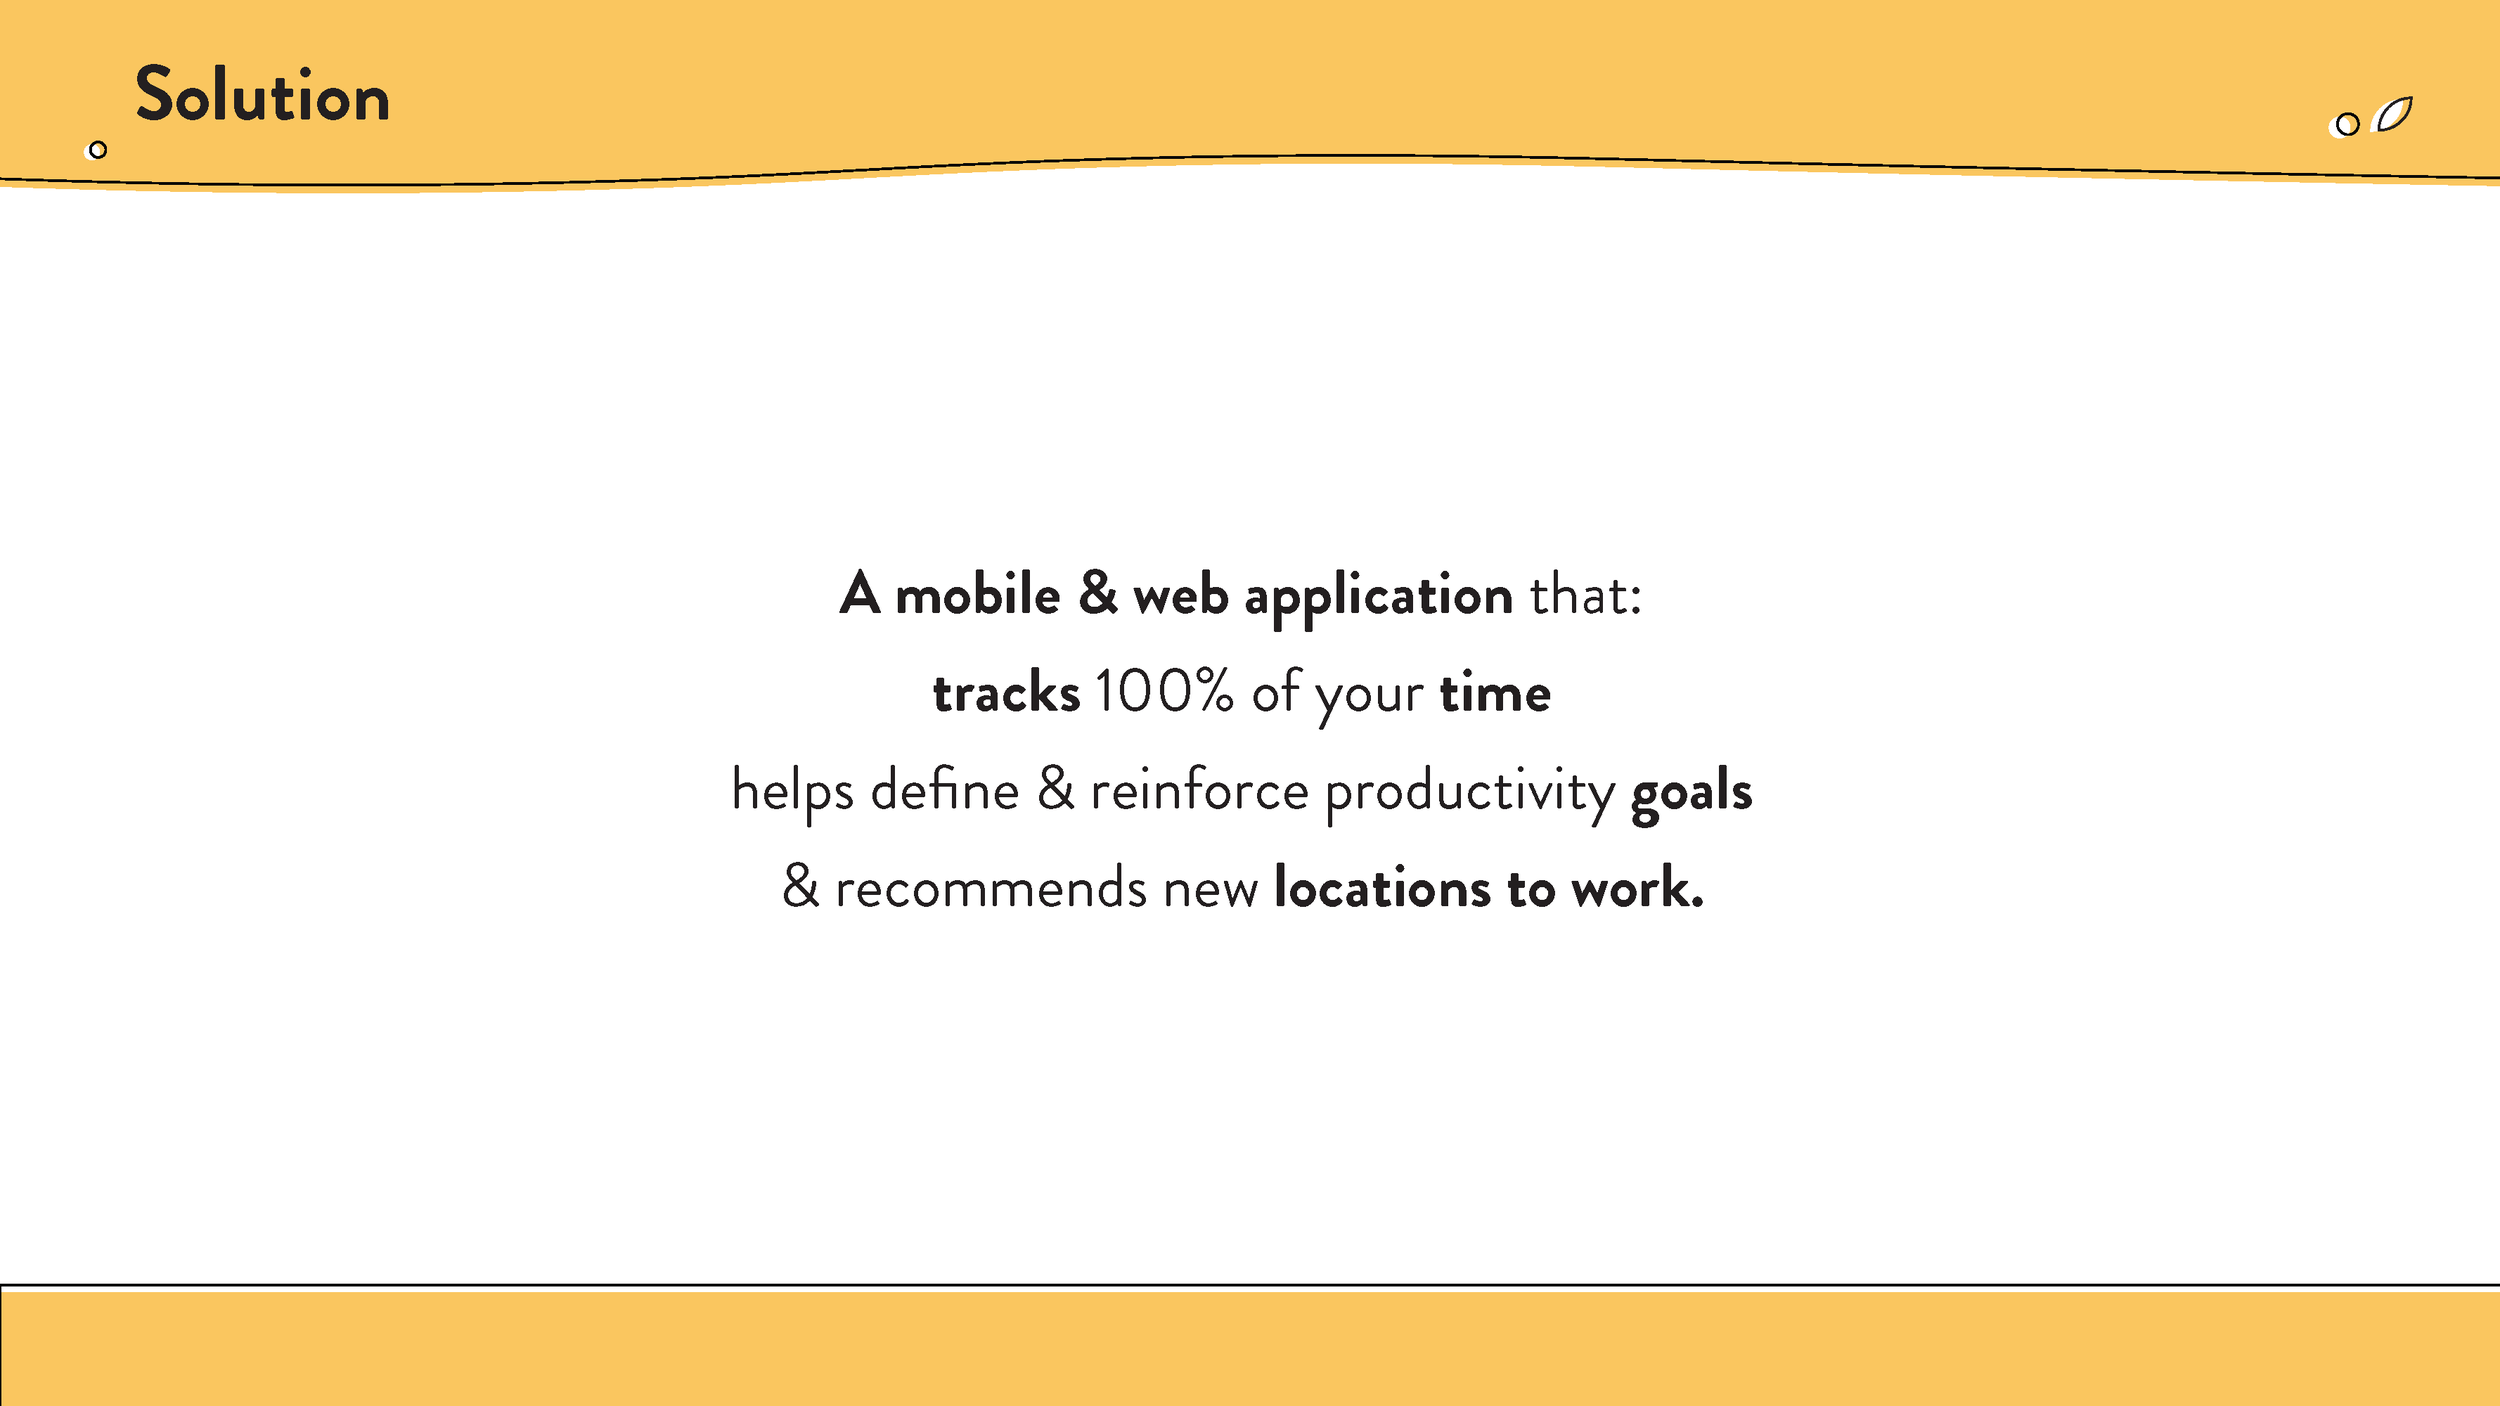
We wanted to improve the idea of prioritizing how time is spent throughout the day & on digital applications. We wanted to make our application track time, evaluate and categorize it properly, block websites, set productivity goals, and to discover productivity based on location. Wherein both cases of goals & locations, our system would recommend suggestions for every user with a unique identity.
We decided to leave out other features during our the development of our prototype in order to focus in on how to fully develop our product model & the problems it intends to solve.
The Design Process
We developed three rounds of prototype drafts. Lo-Fidelity wireframes, high fidelity prototype for user testing, & a final prototype for our final product pitch. We conducted user testing on 10 individuals, using concept validation & usability testing to navigate the viability of our platform & the form of our UI.
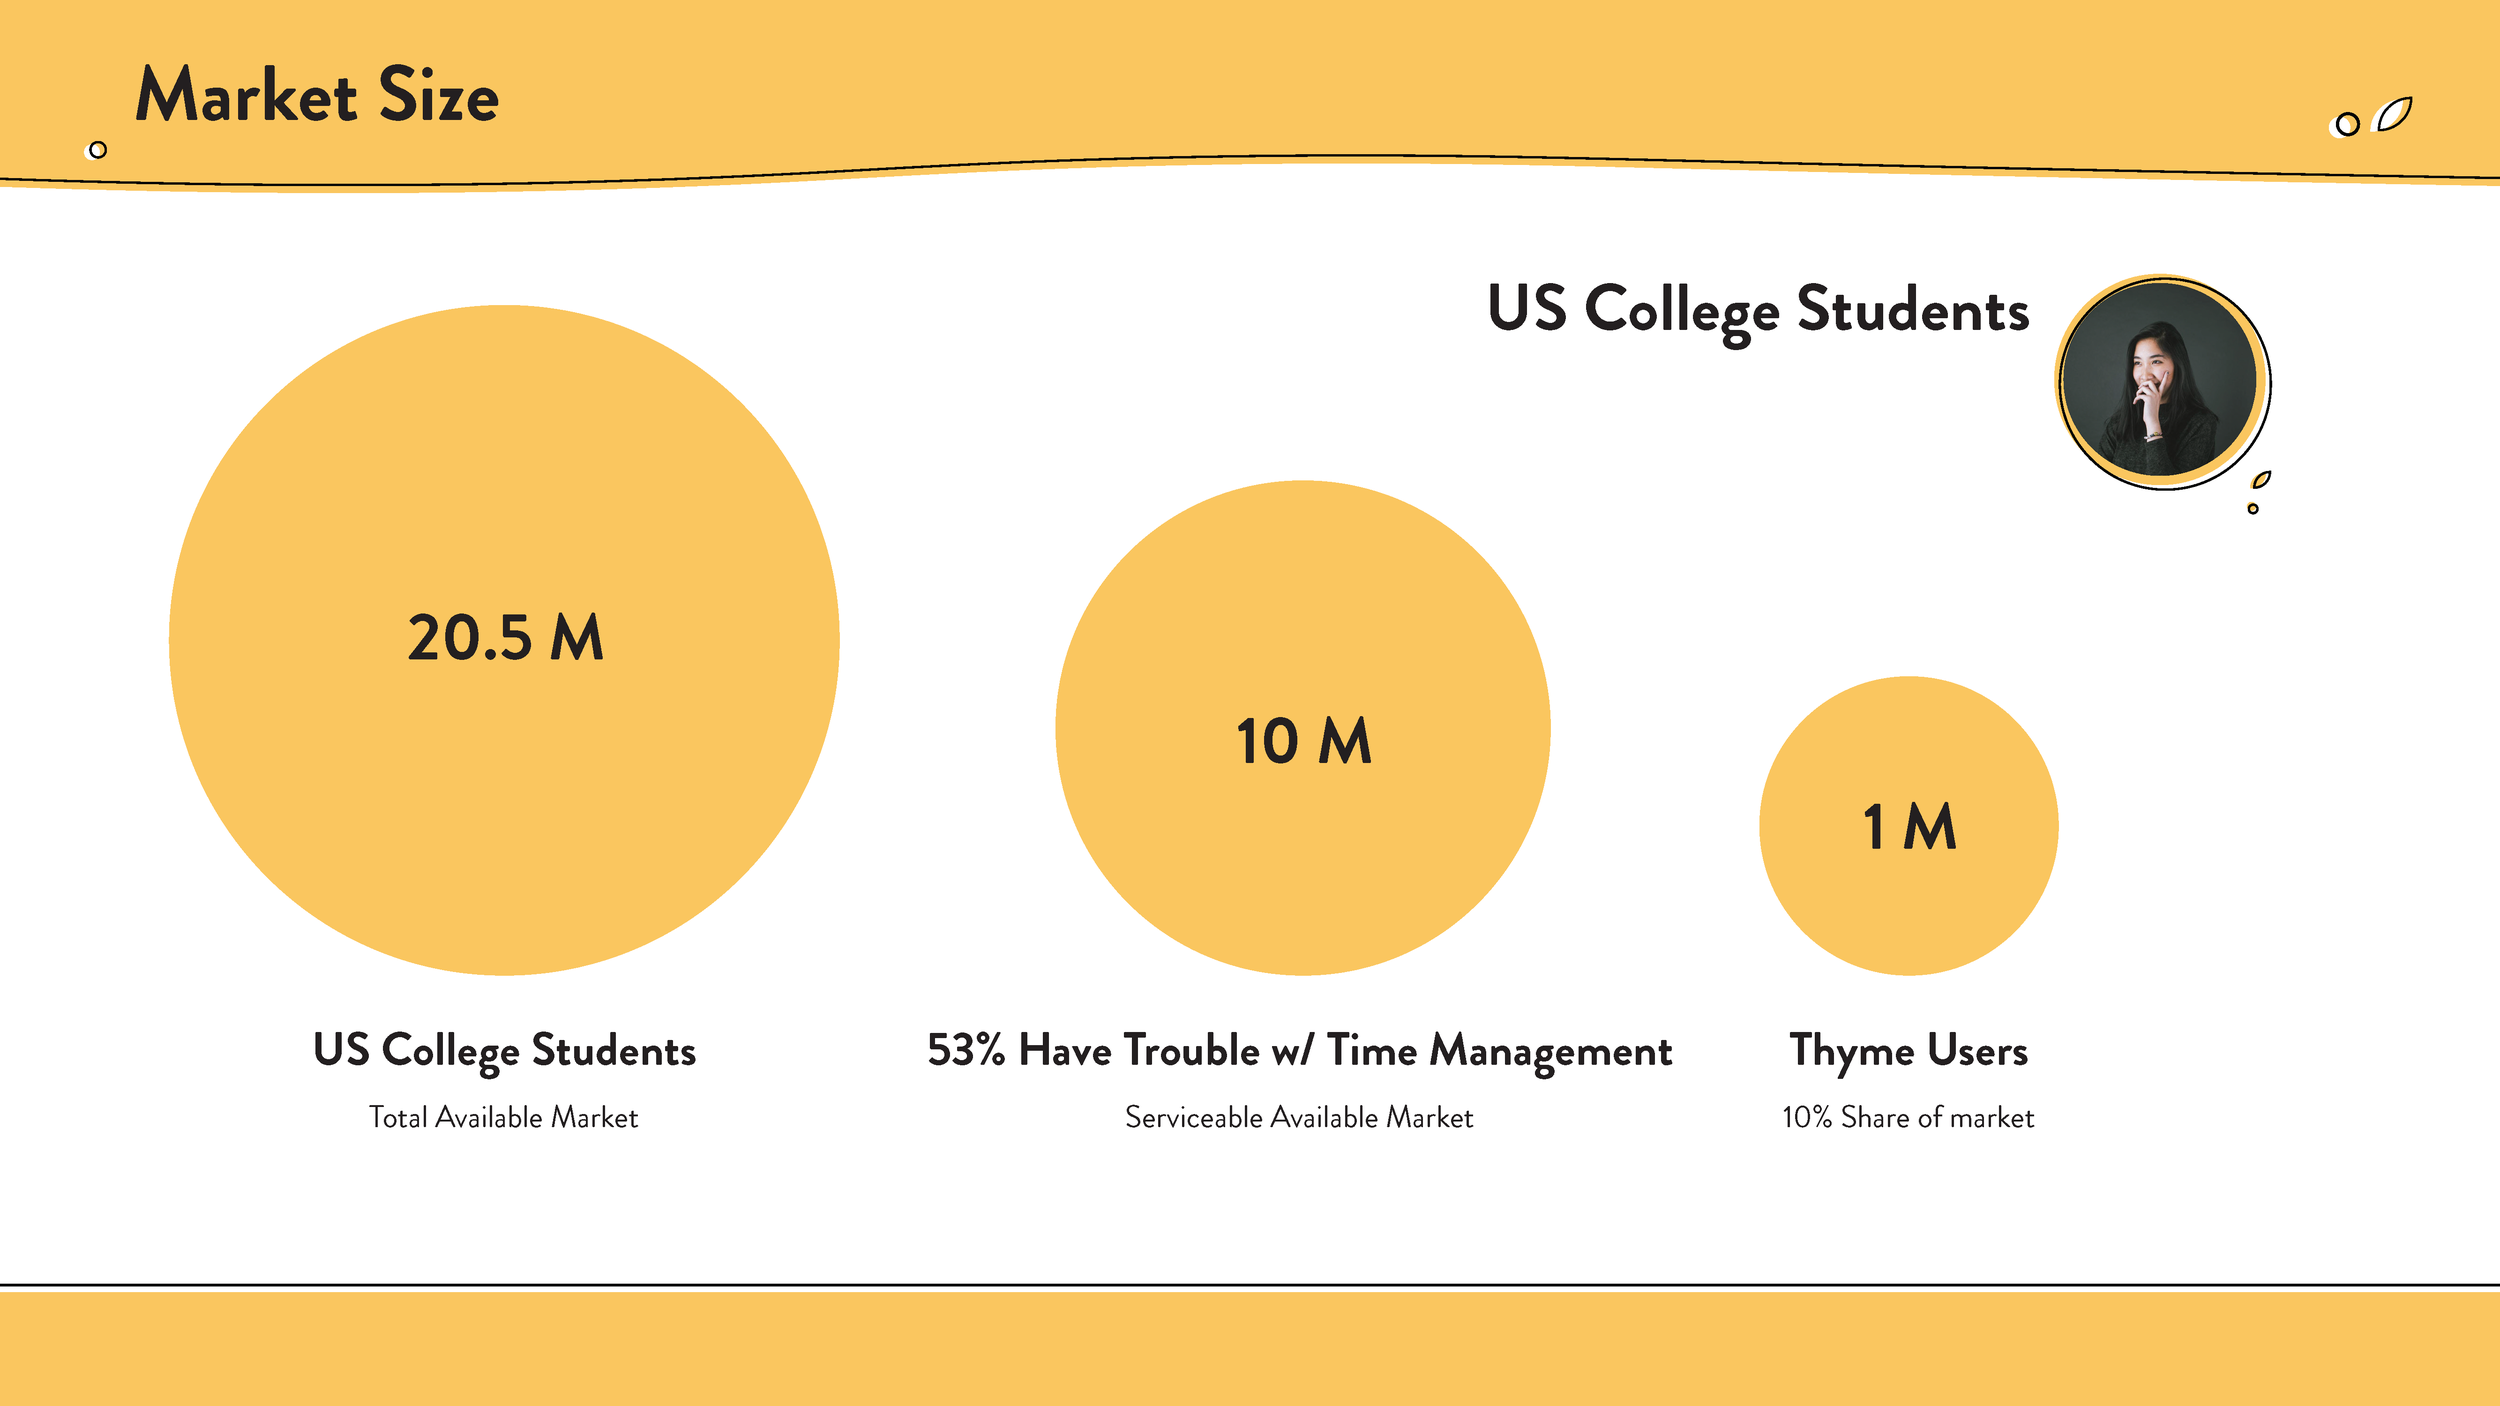
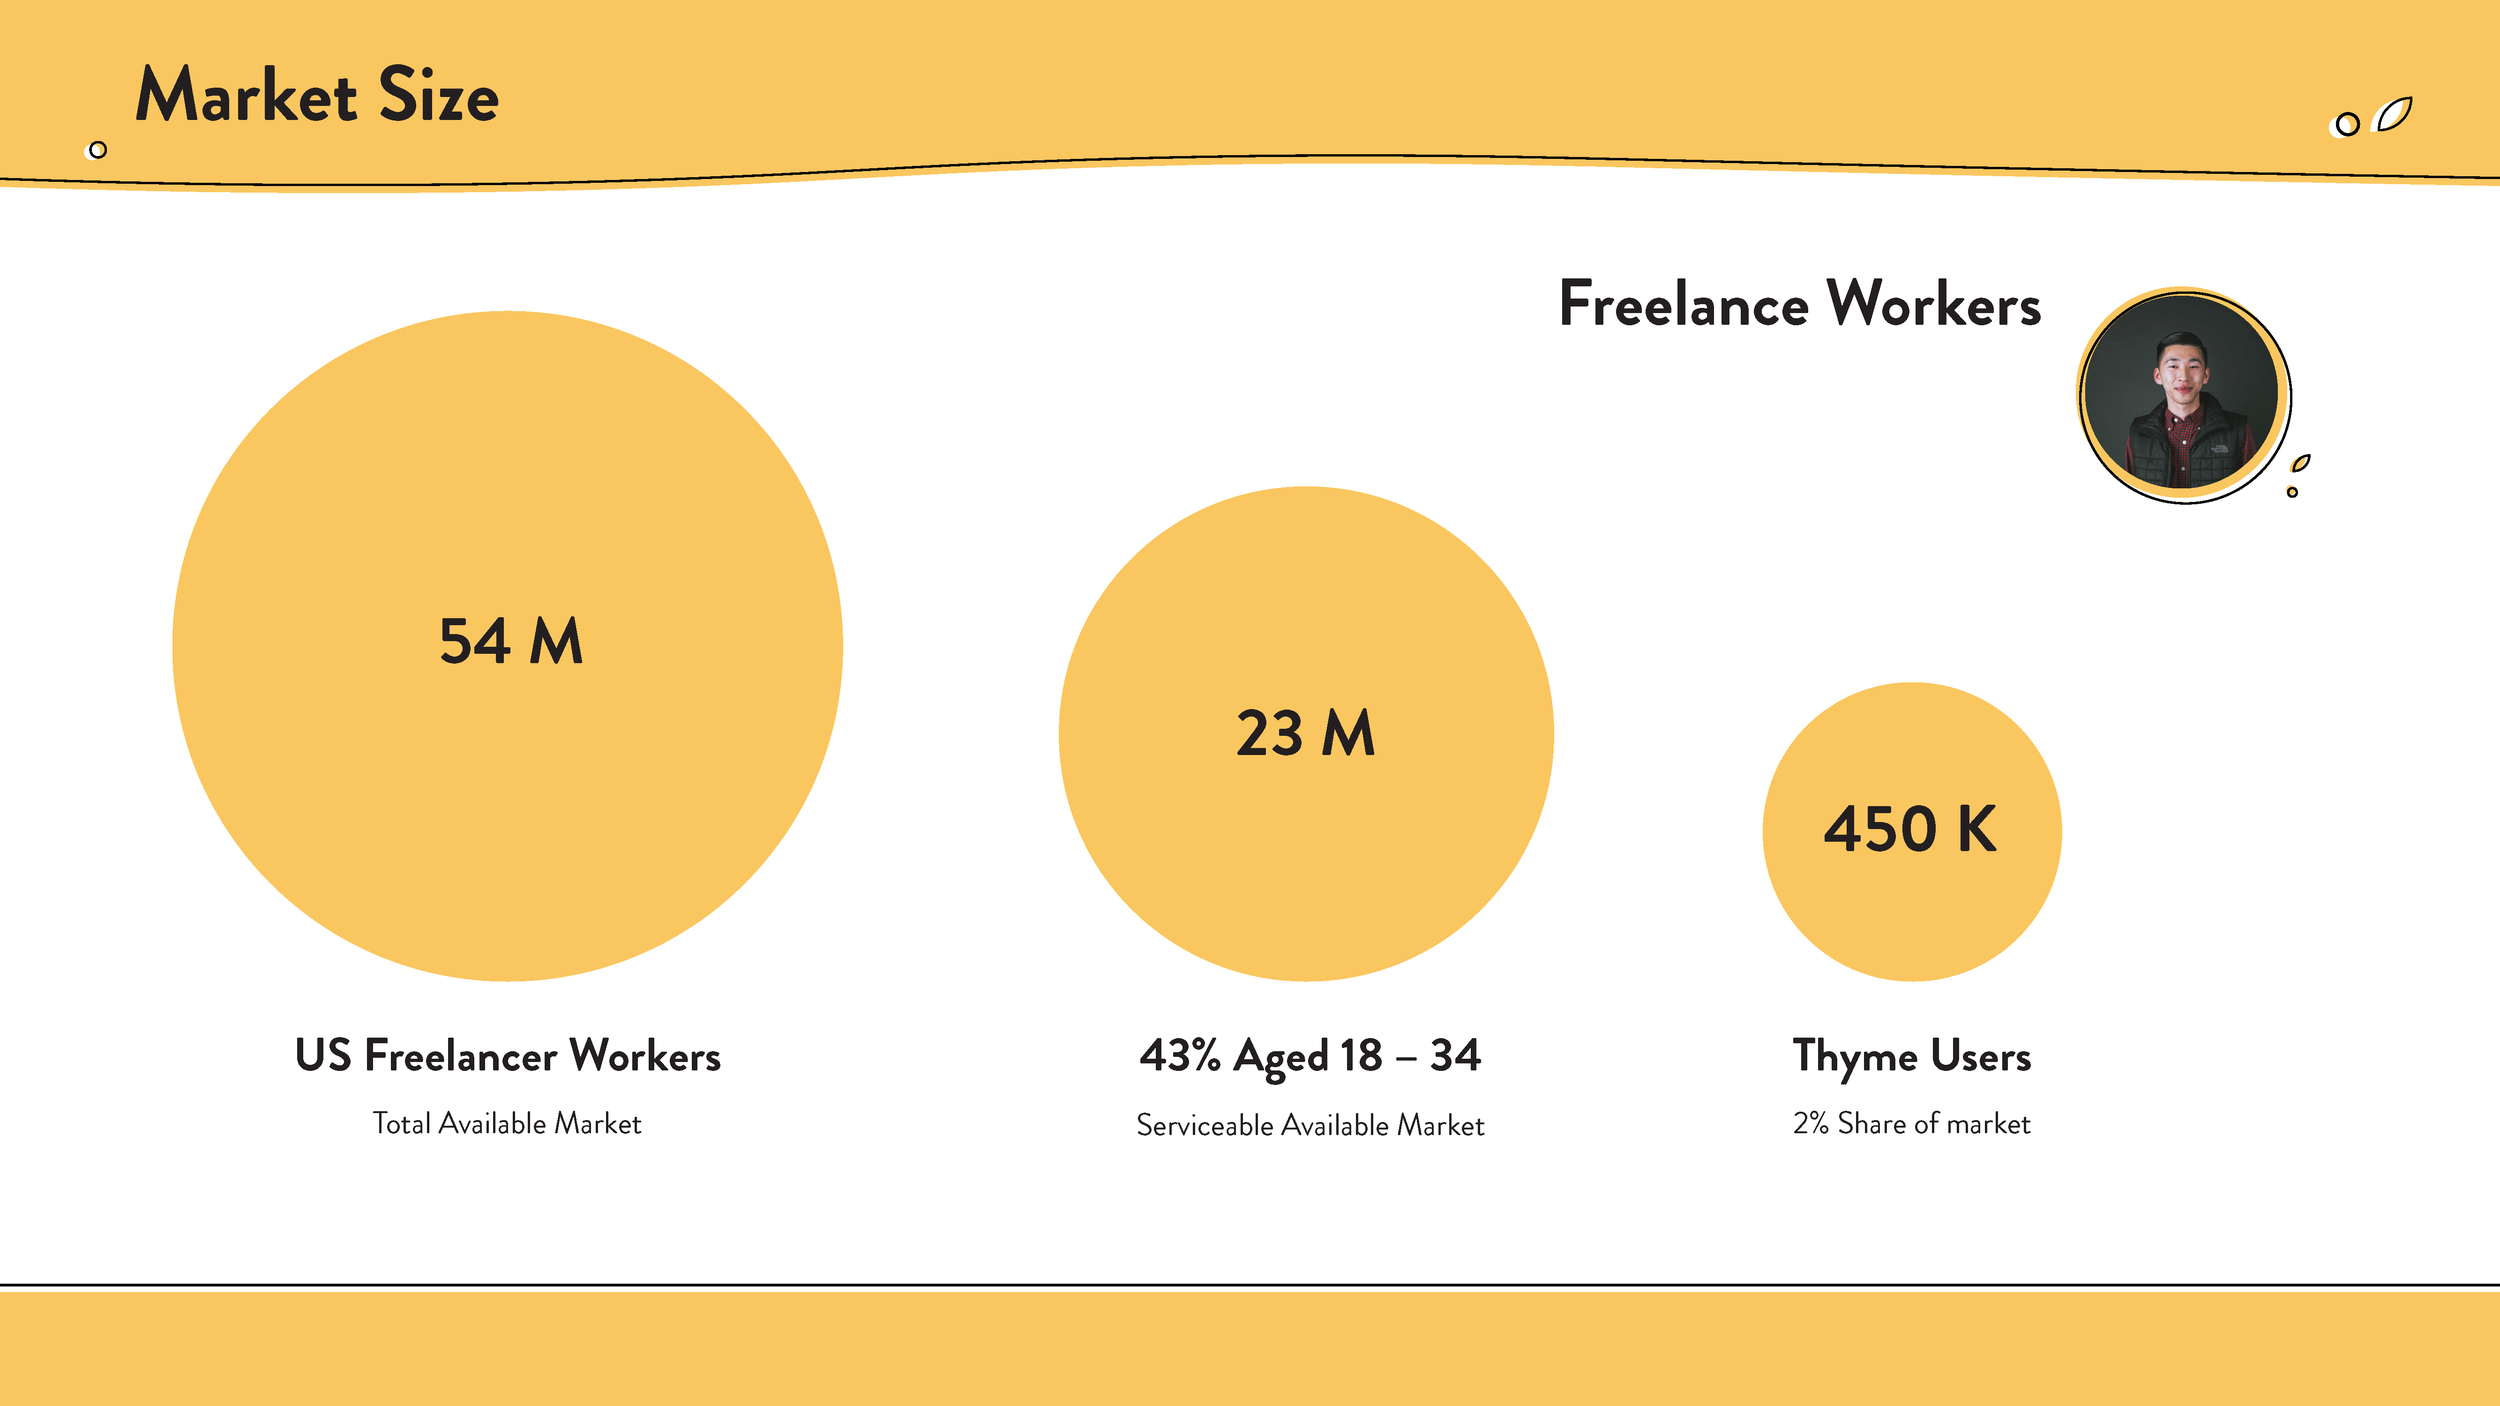
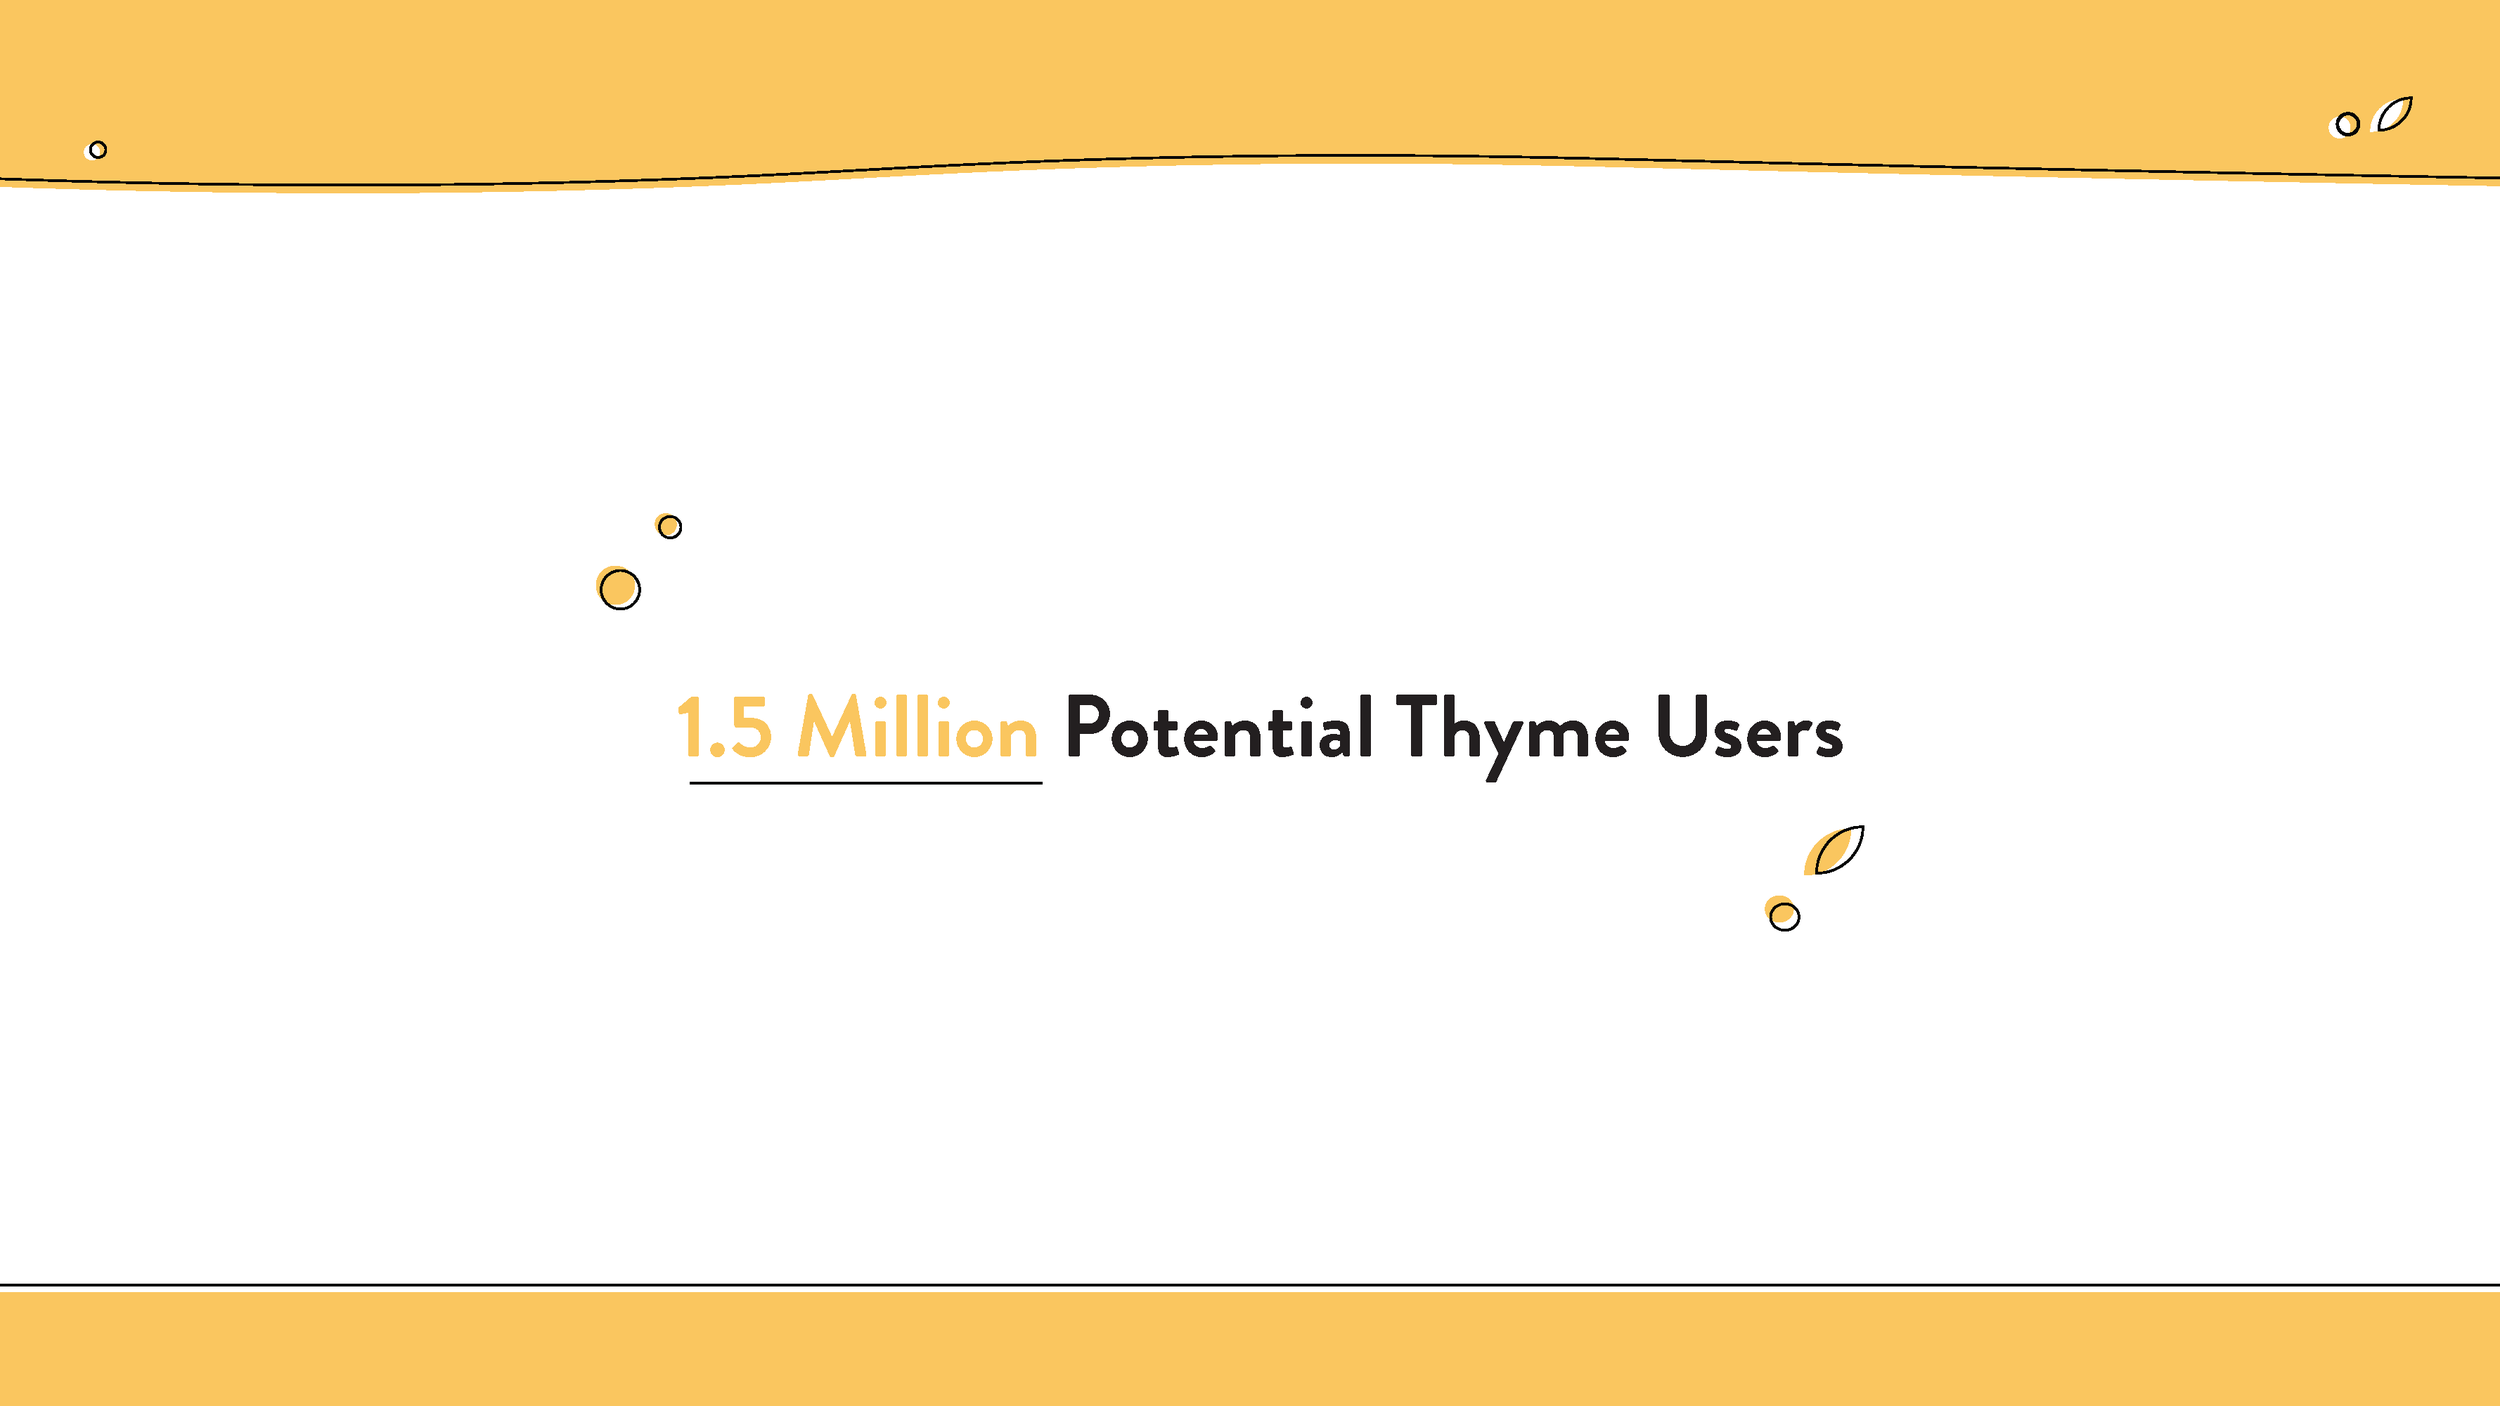
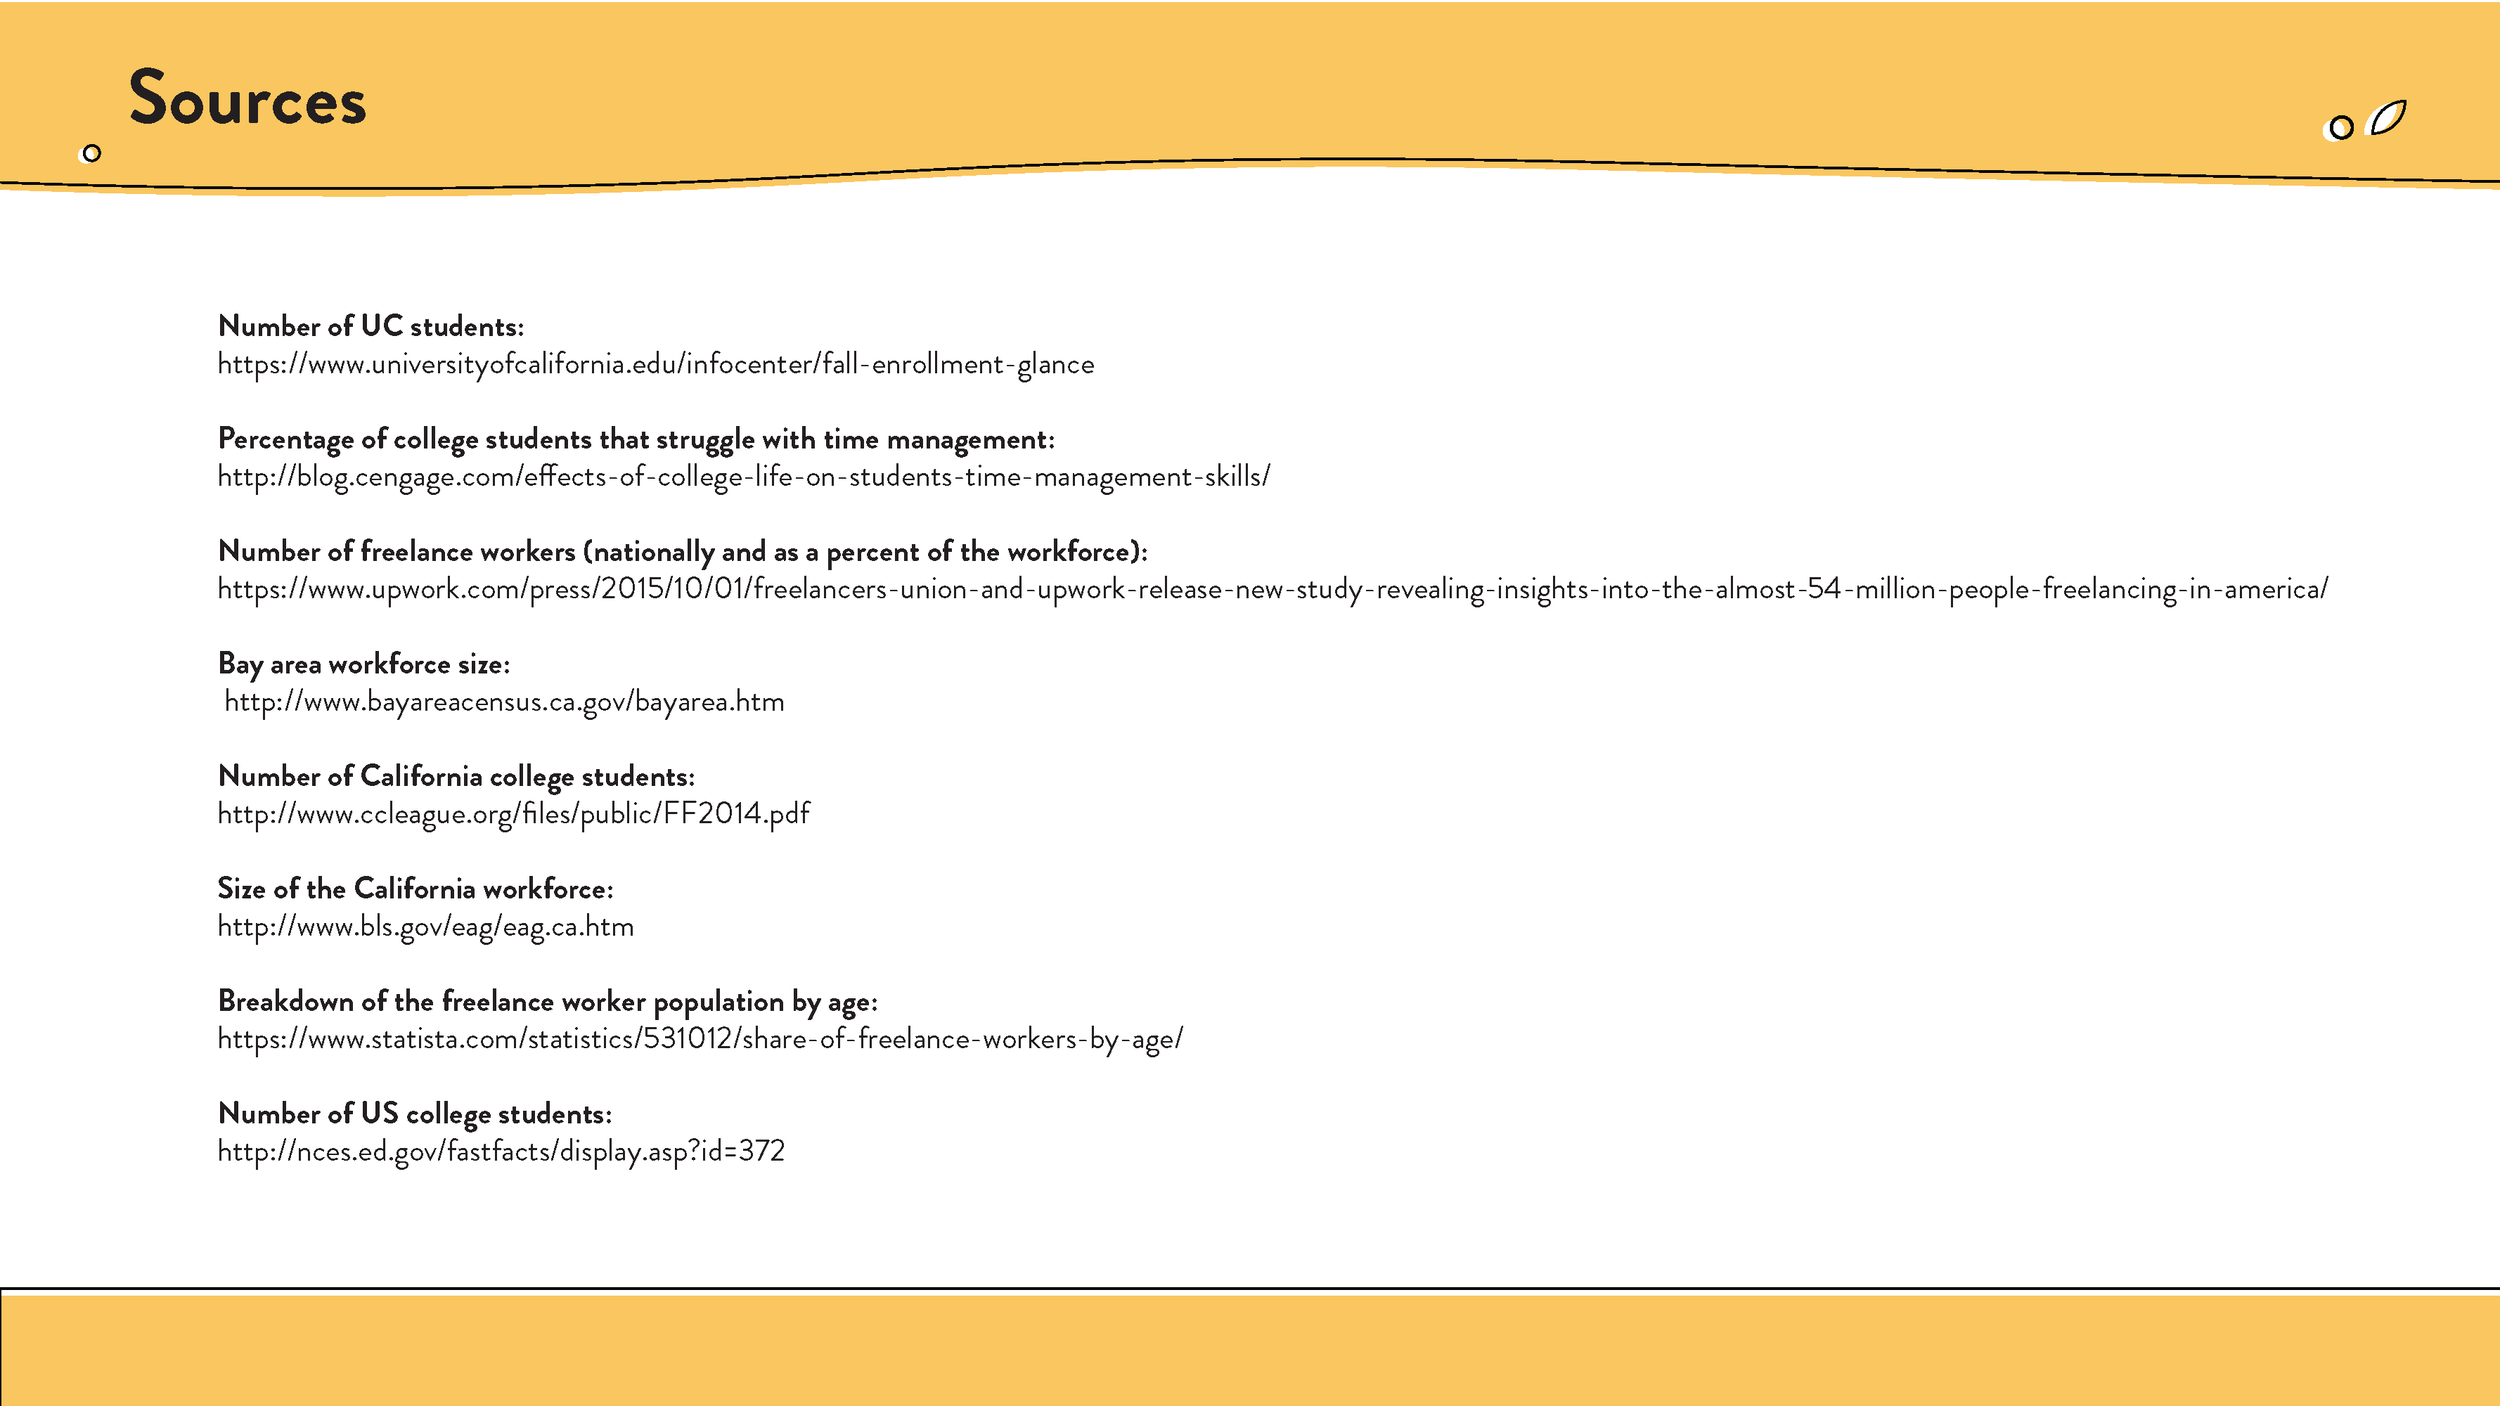
Market Research & Users
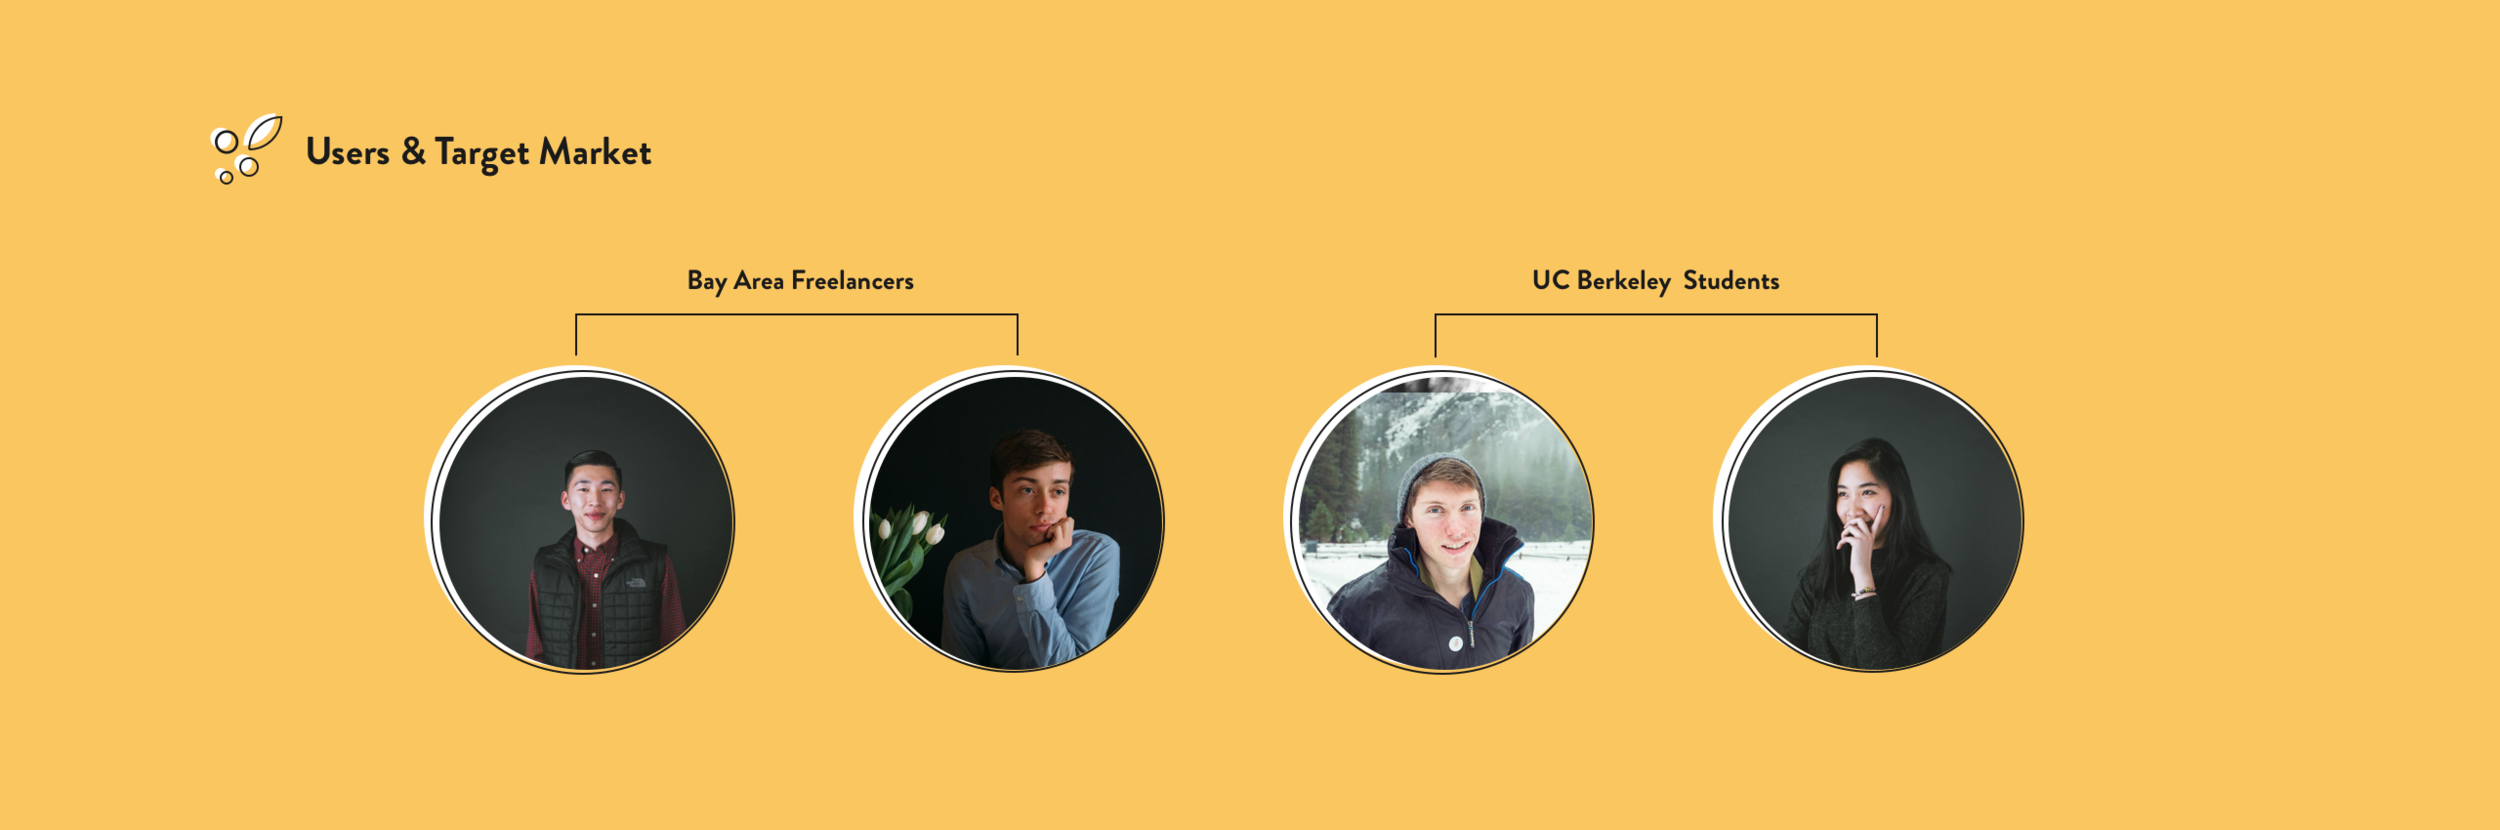
User Needs
Relevance ; Data generated by our product needs to provide clear, relevant data about productivity & web use habits in order for users to find value they can derive
Accountability ; There needs to be a continuous reliability from product to try to remind, alert, & keep the user accountable in improving their habits & help them achieve their goals
Discovering Productivity ; Through smart recommendations, users need to discover new methods & reasons to improve their daily productivity
To view our User feedback please visit this link.
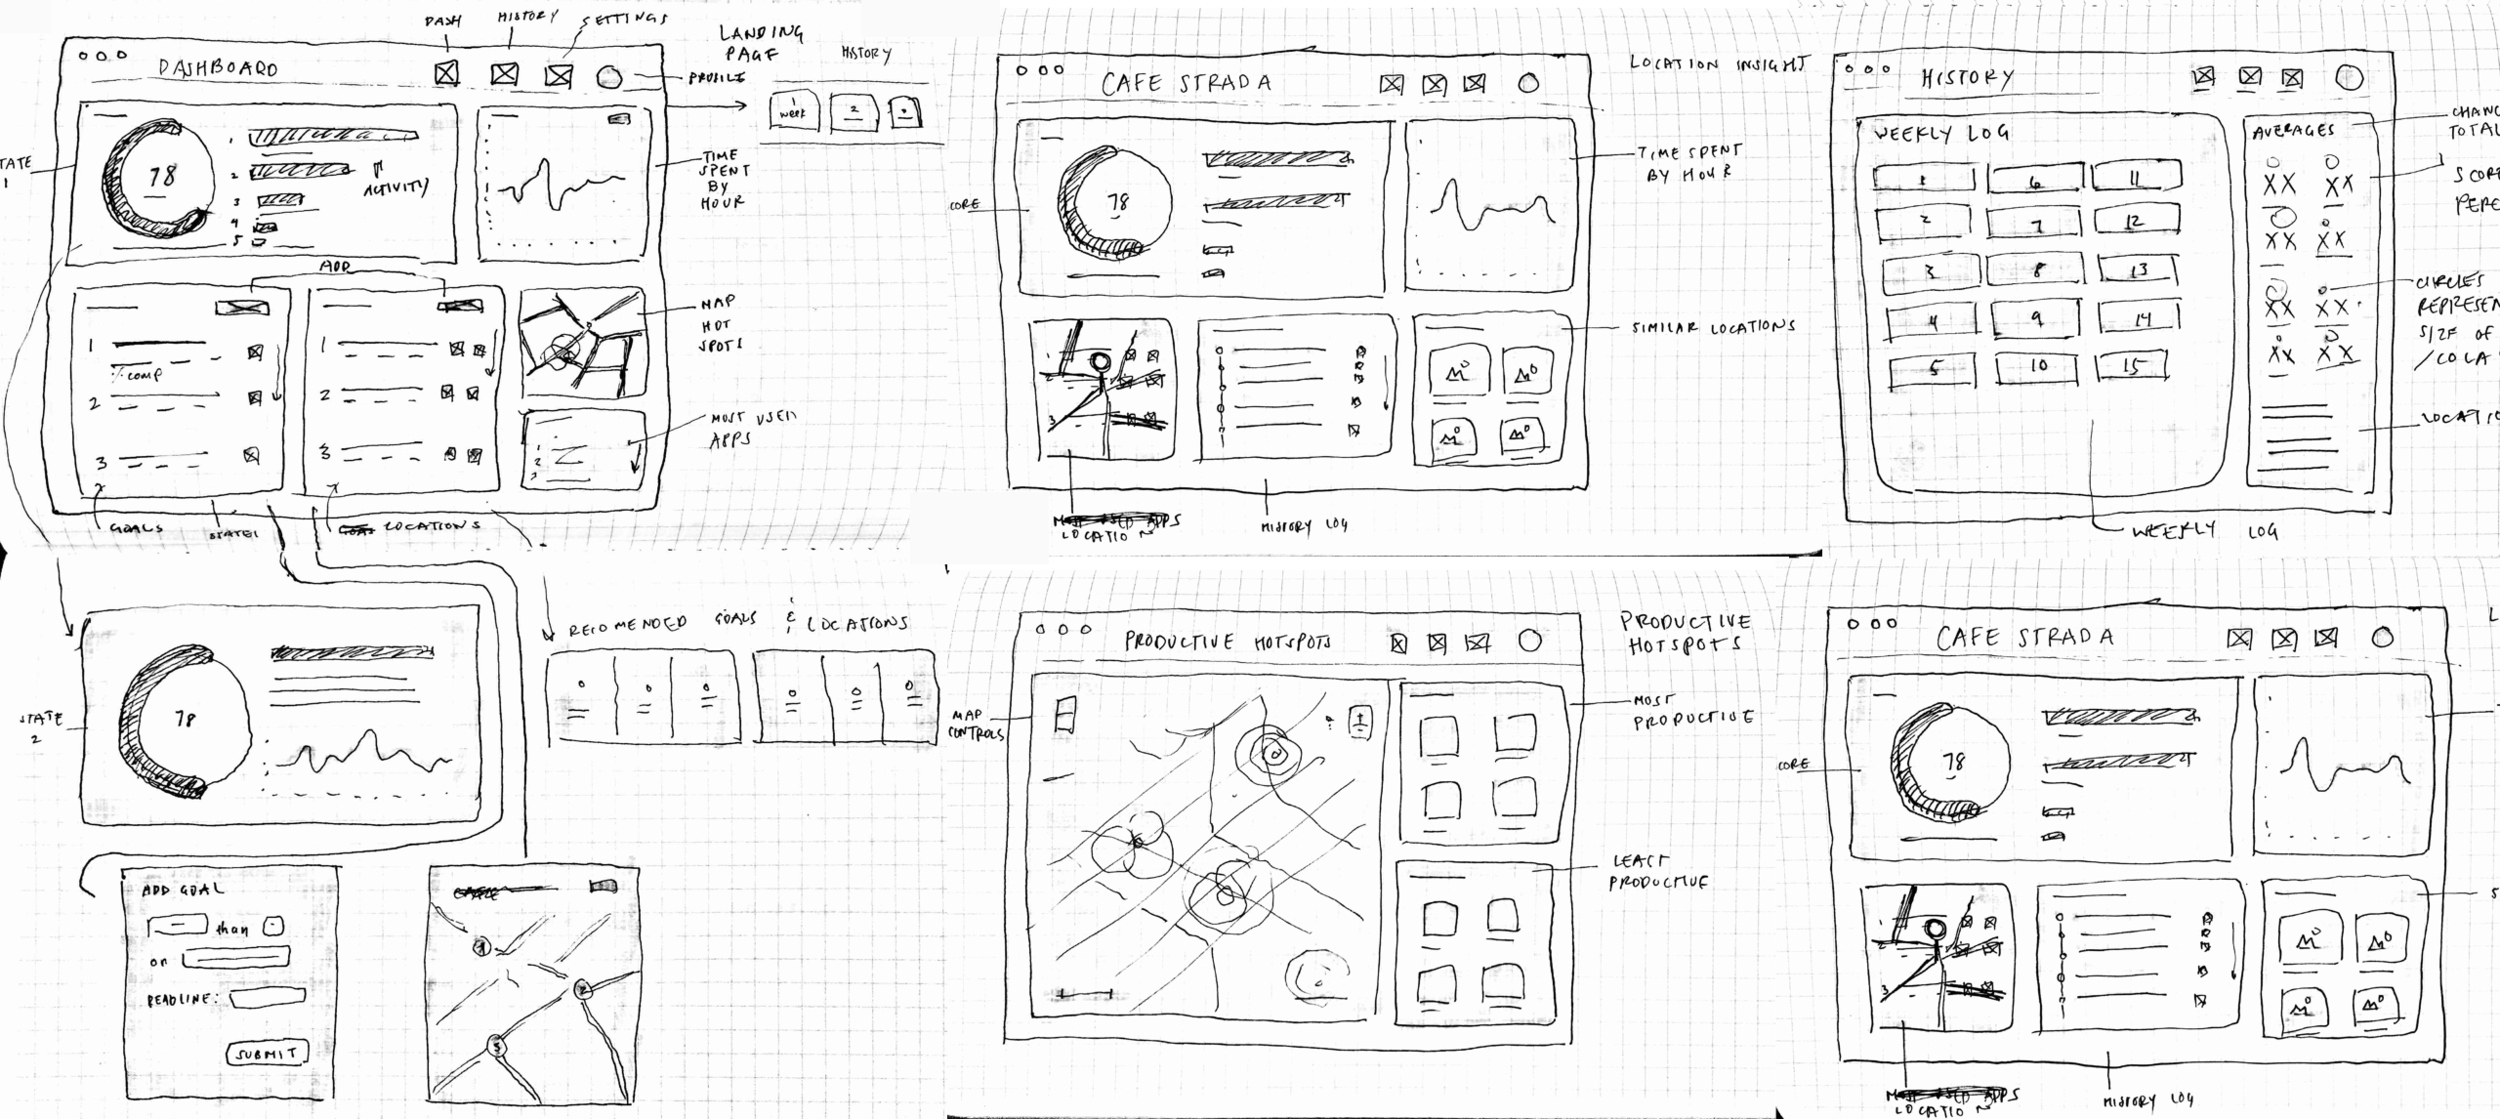
Lo-Fi Sketches & Wireframes
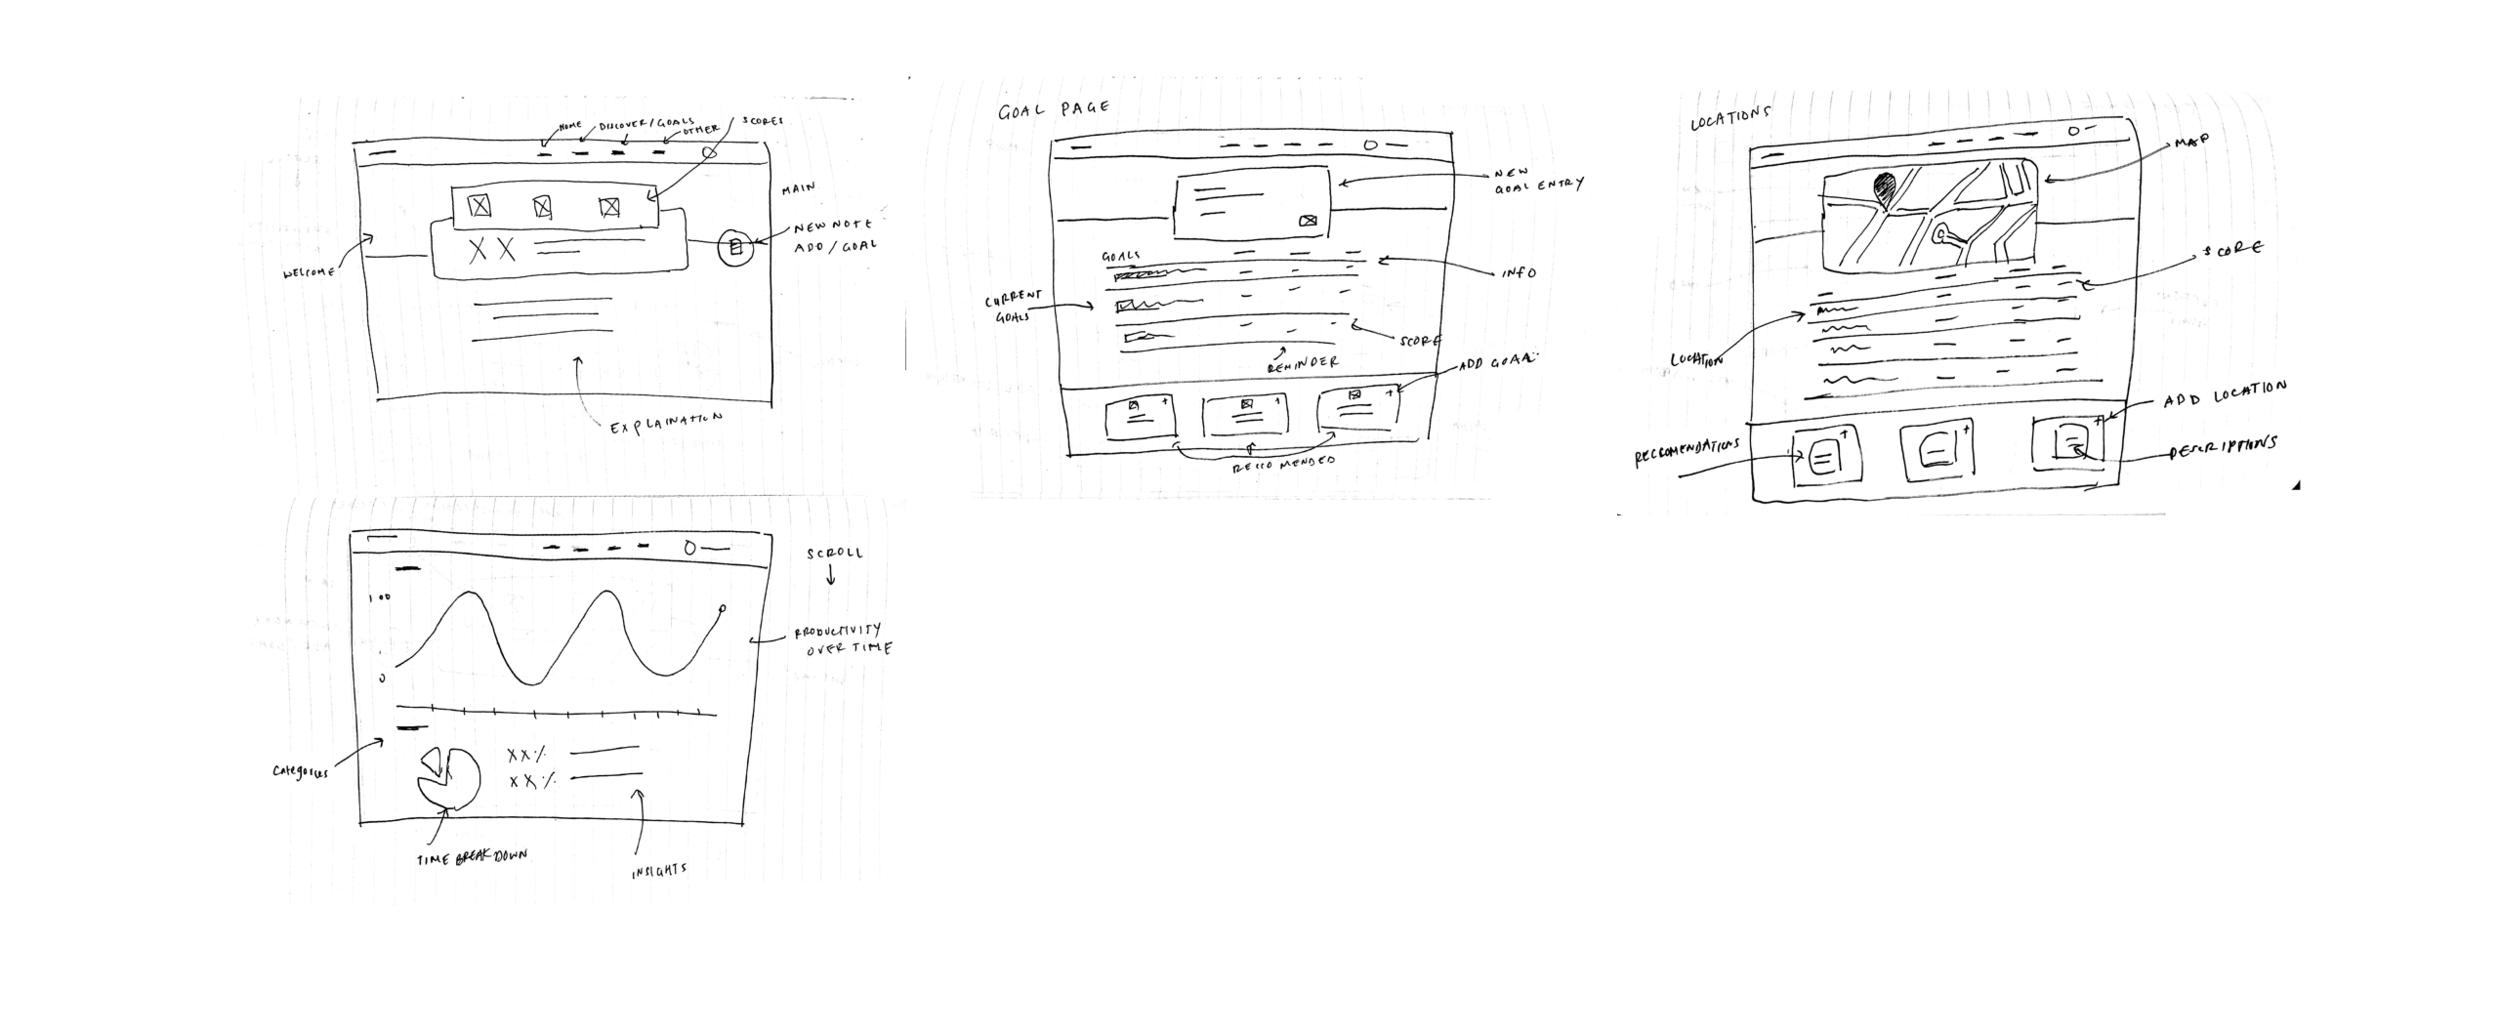
Medium-Fidelity Sketches & Wireframes
Here we decided to include the preliminary visual design of our product in order to allow the users to get a feel for how they would interact with the information a little better. Usually we would not attempt to use this amount of detail in a user test, but for the sake of the project, our timeline allowed for extra embellishments, as we attempted to minimize the discrepancy between real product & UI, without interfering with the process of testing.
User Testing
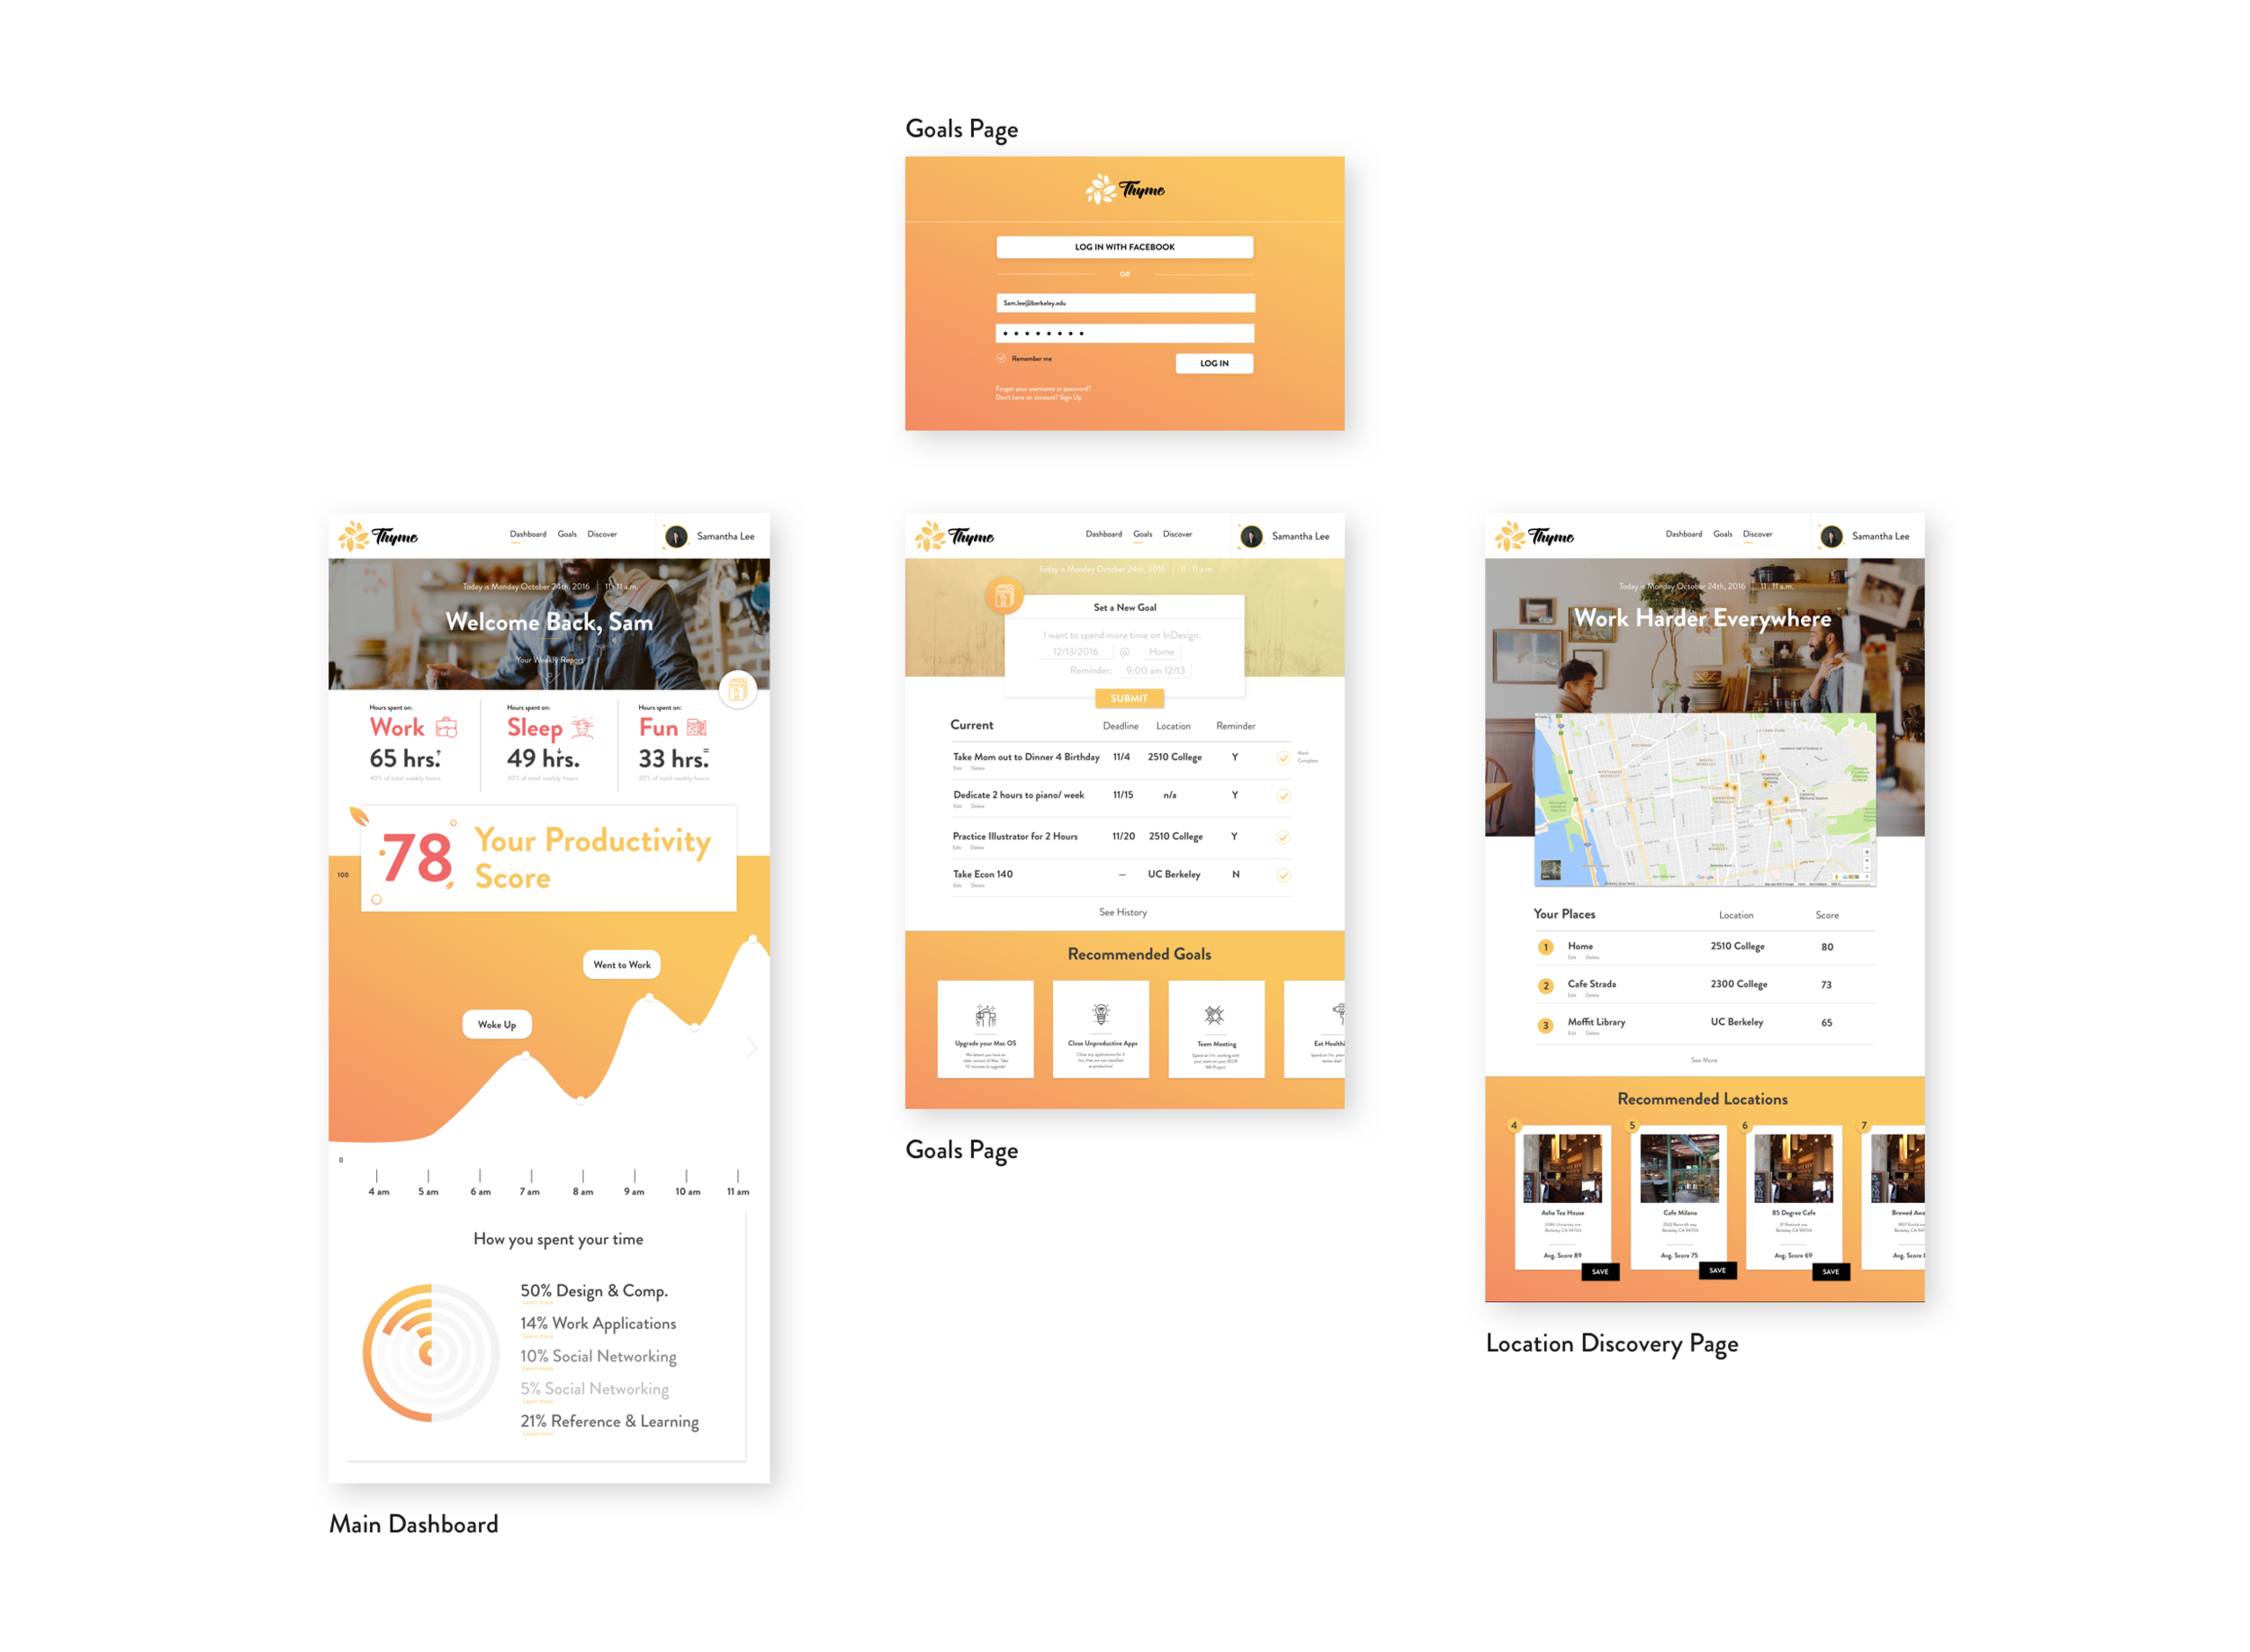
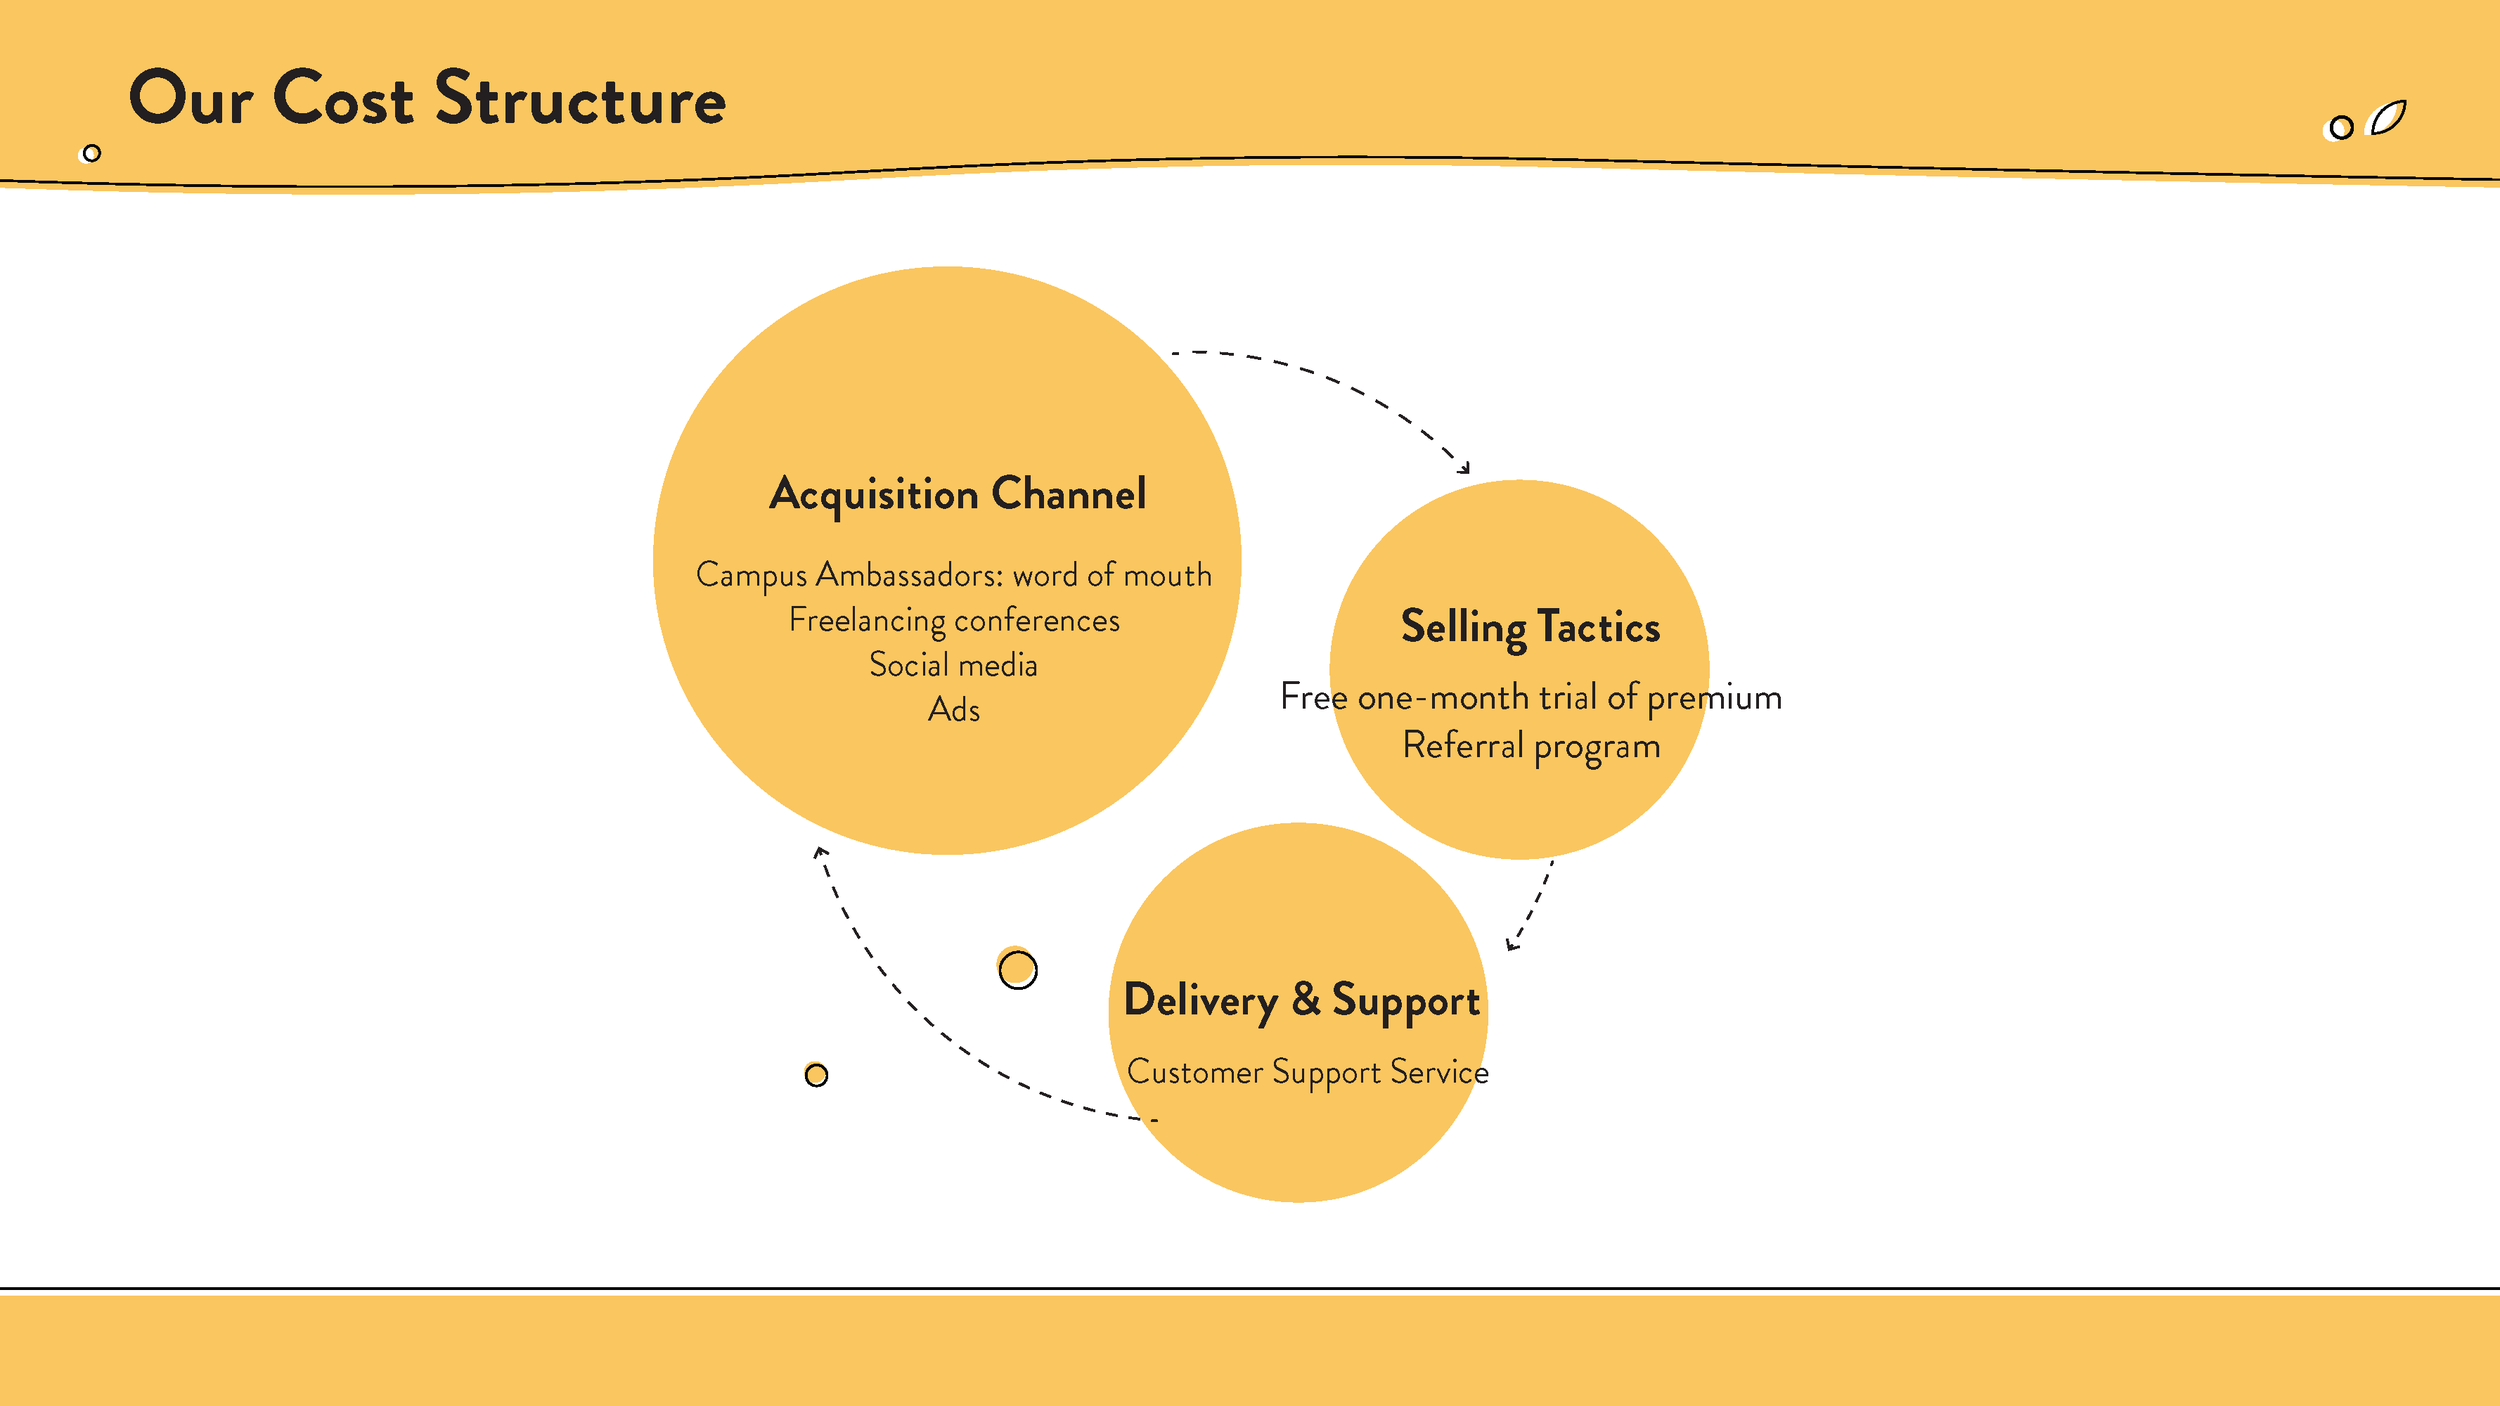
From our first design drafts, we rapidly prototyped a dashboard that featured or key features. Although Thyme would run in the background of cellphone devices and web + computer applications, the information would come in two forms– emailed weekly reports & a web application through our Thyme website. Through our user interviews we found that our target demographic, that of students & freelancers, our potentials users found the notion of tracking & measuring time used on applications paired with recommendations/suggestions was appealing in a freemium based method.
Feedback
Our users enjoyed the colors & the overall design but found that in place of accessibility of information, our dashboard design was confusing in hierarchy & purpose.
Productivity scores seemed irrelevantly marked & similarly the percentages model did not make clear sense to the participants in our study. They wanted more insights into how their time was being spent. For example, how each hour was spent on what applications.
Concept Validation
When presented with our ideas, many users were excited about the potential behind our product. Most of issues drew from visual hierarchy or limited movement between screens, which signaled to us, an assurance of the validity behind our product's purpose & value proposition.
Hi-Fidelity Prototype
Here I will go into depth about the form of each page layout, the decisions that were made & the design choices.
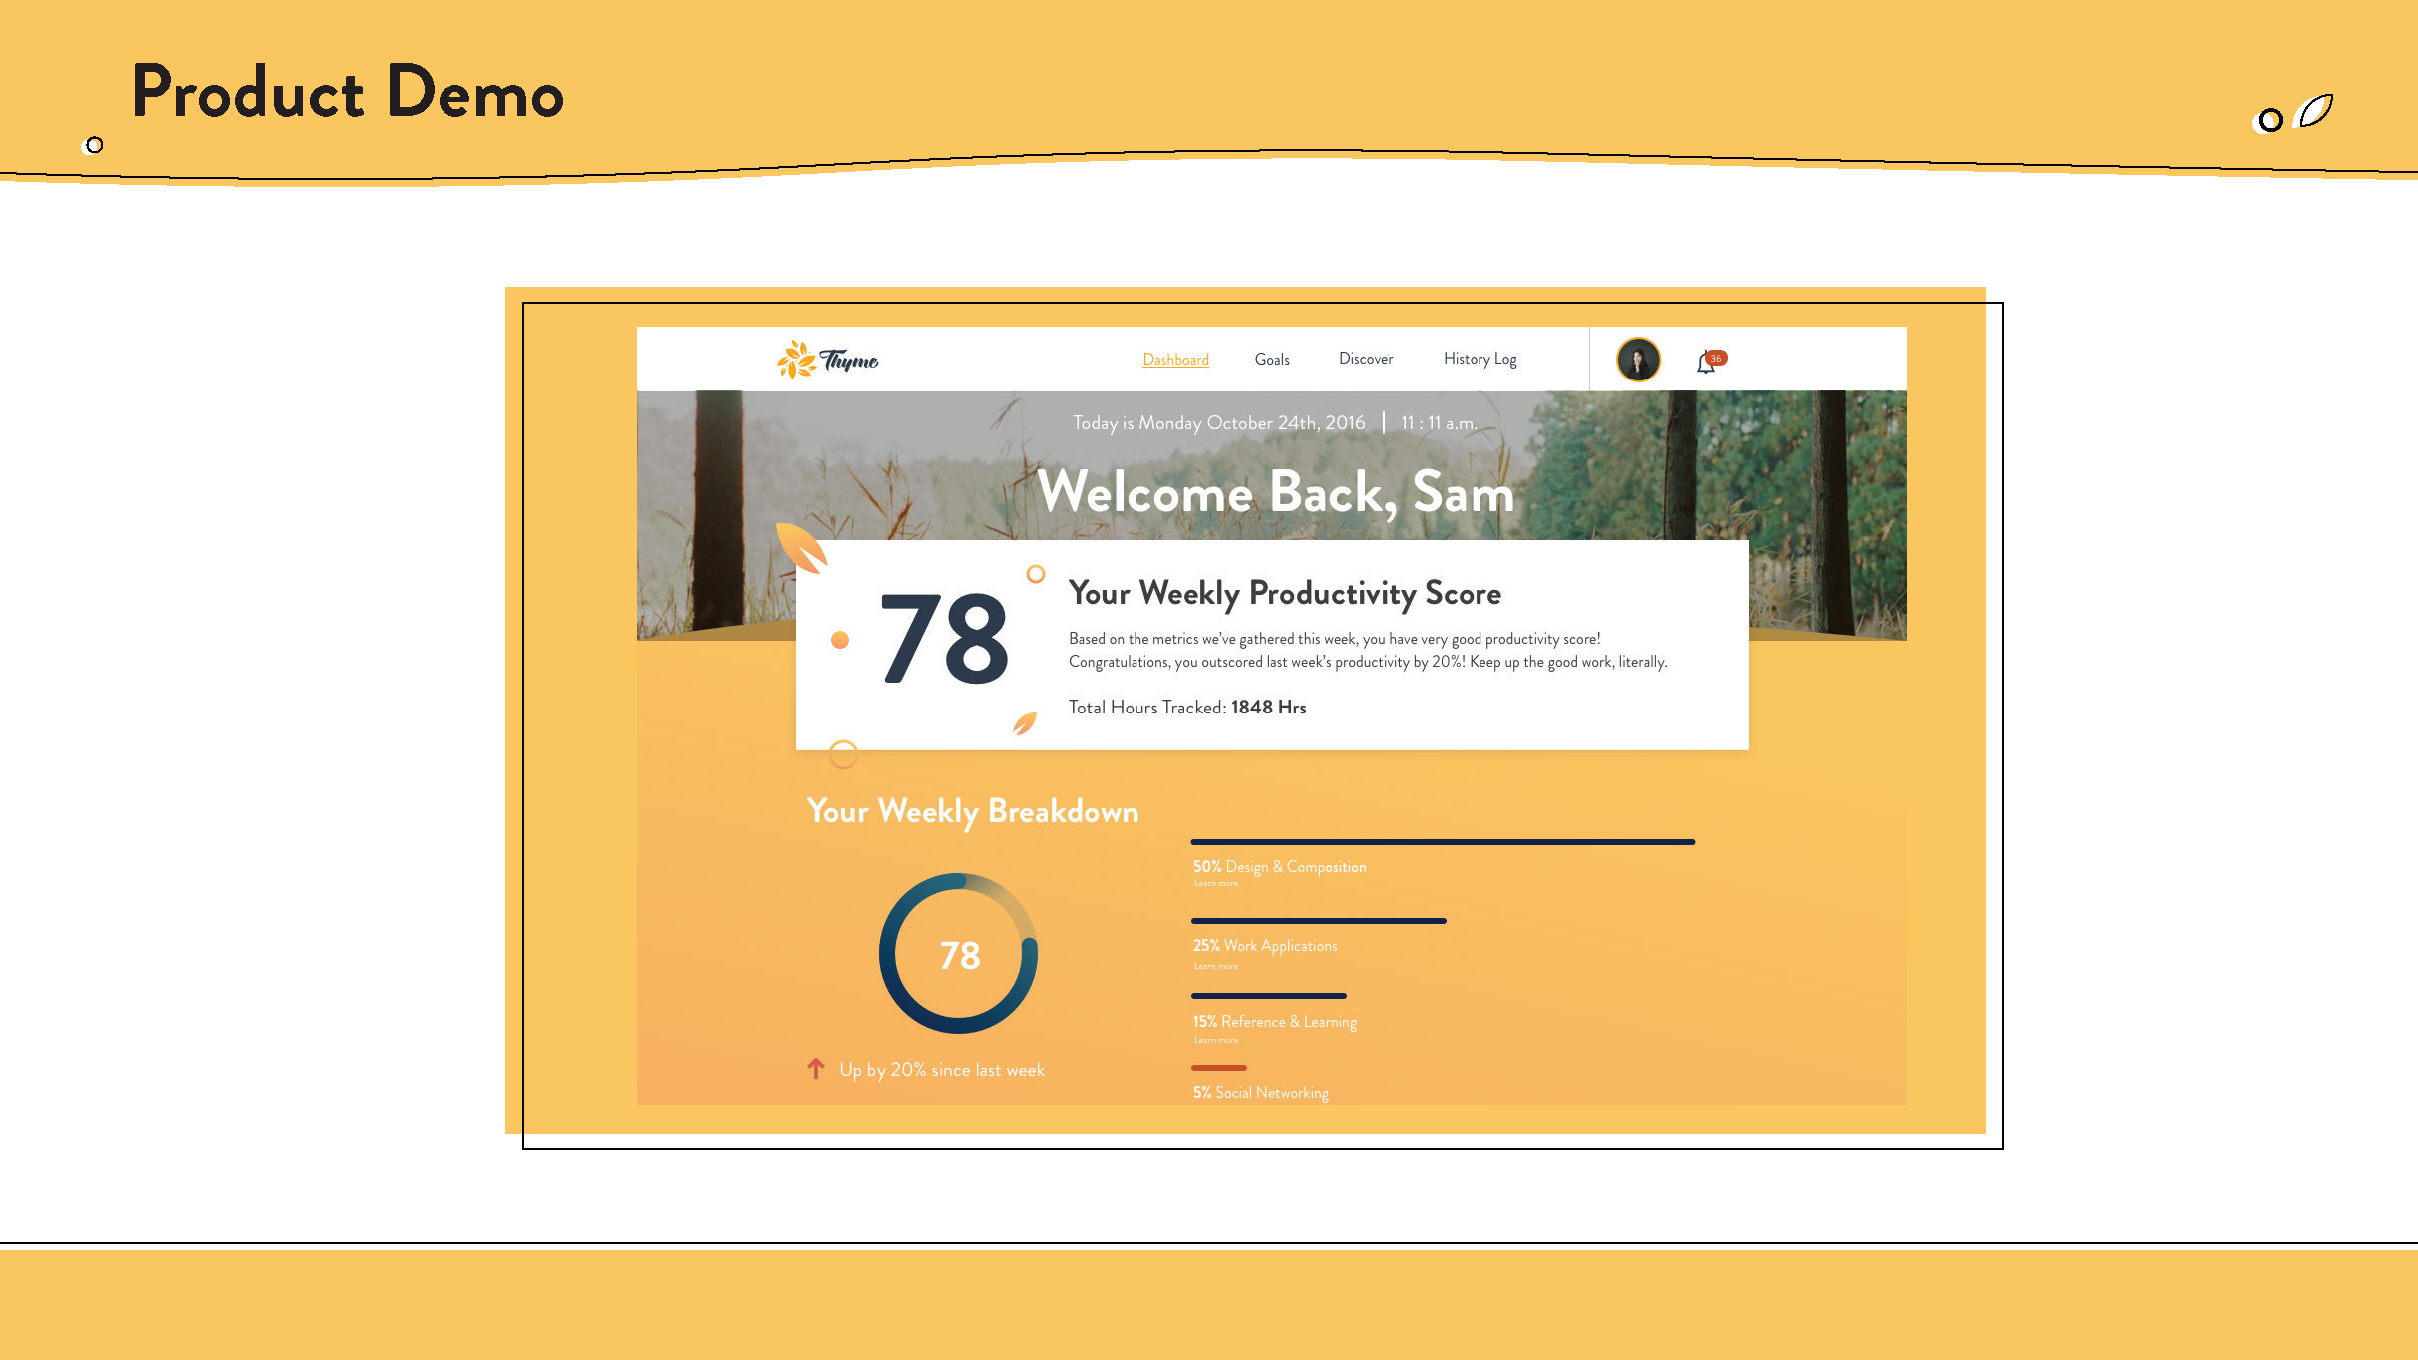
Dashboard
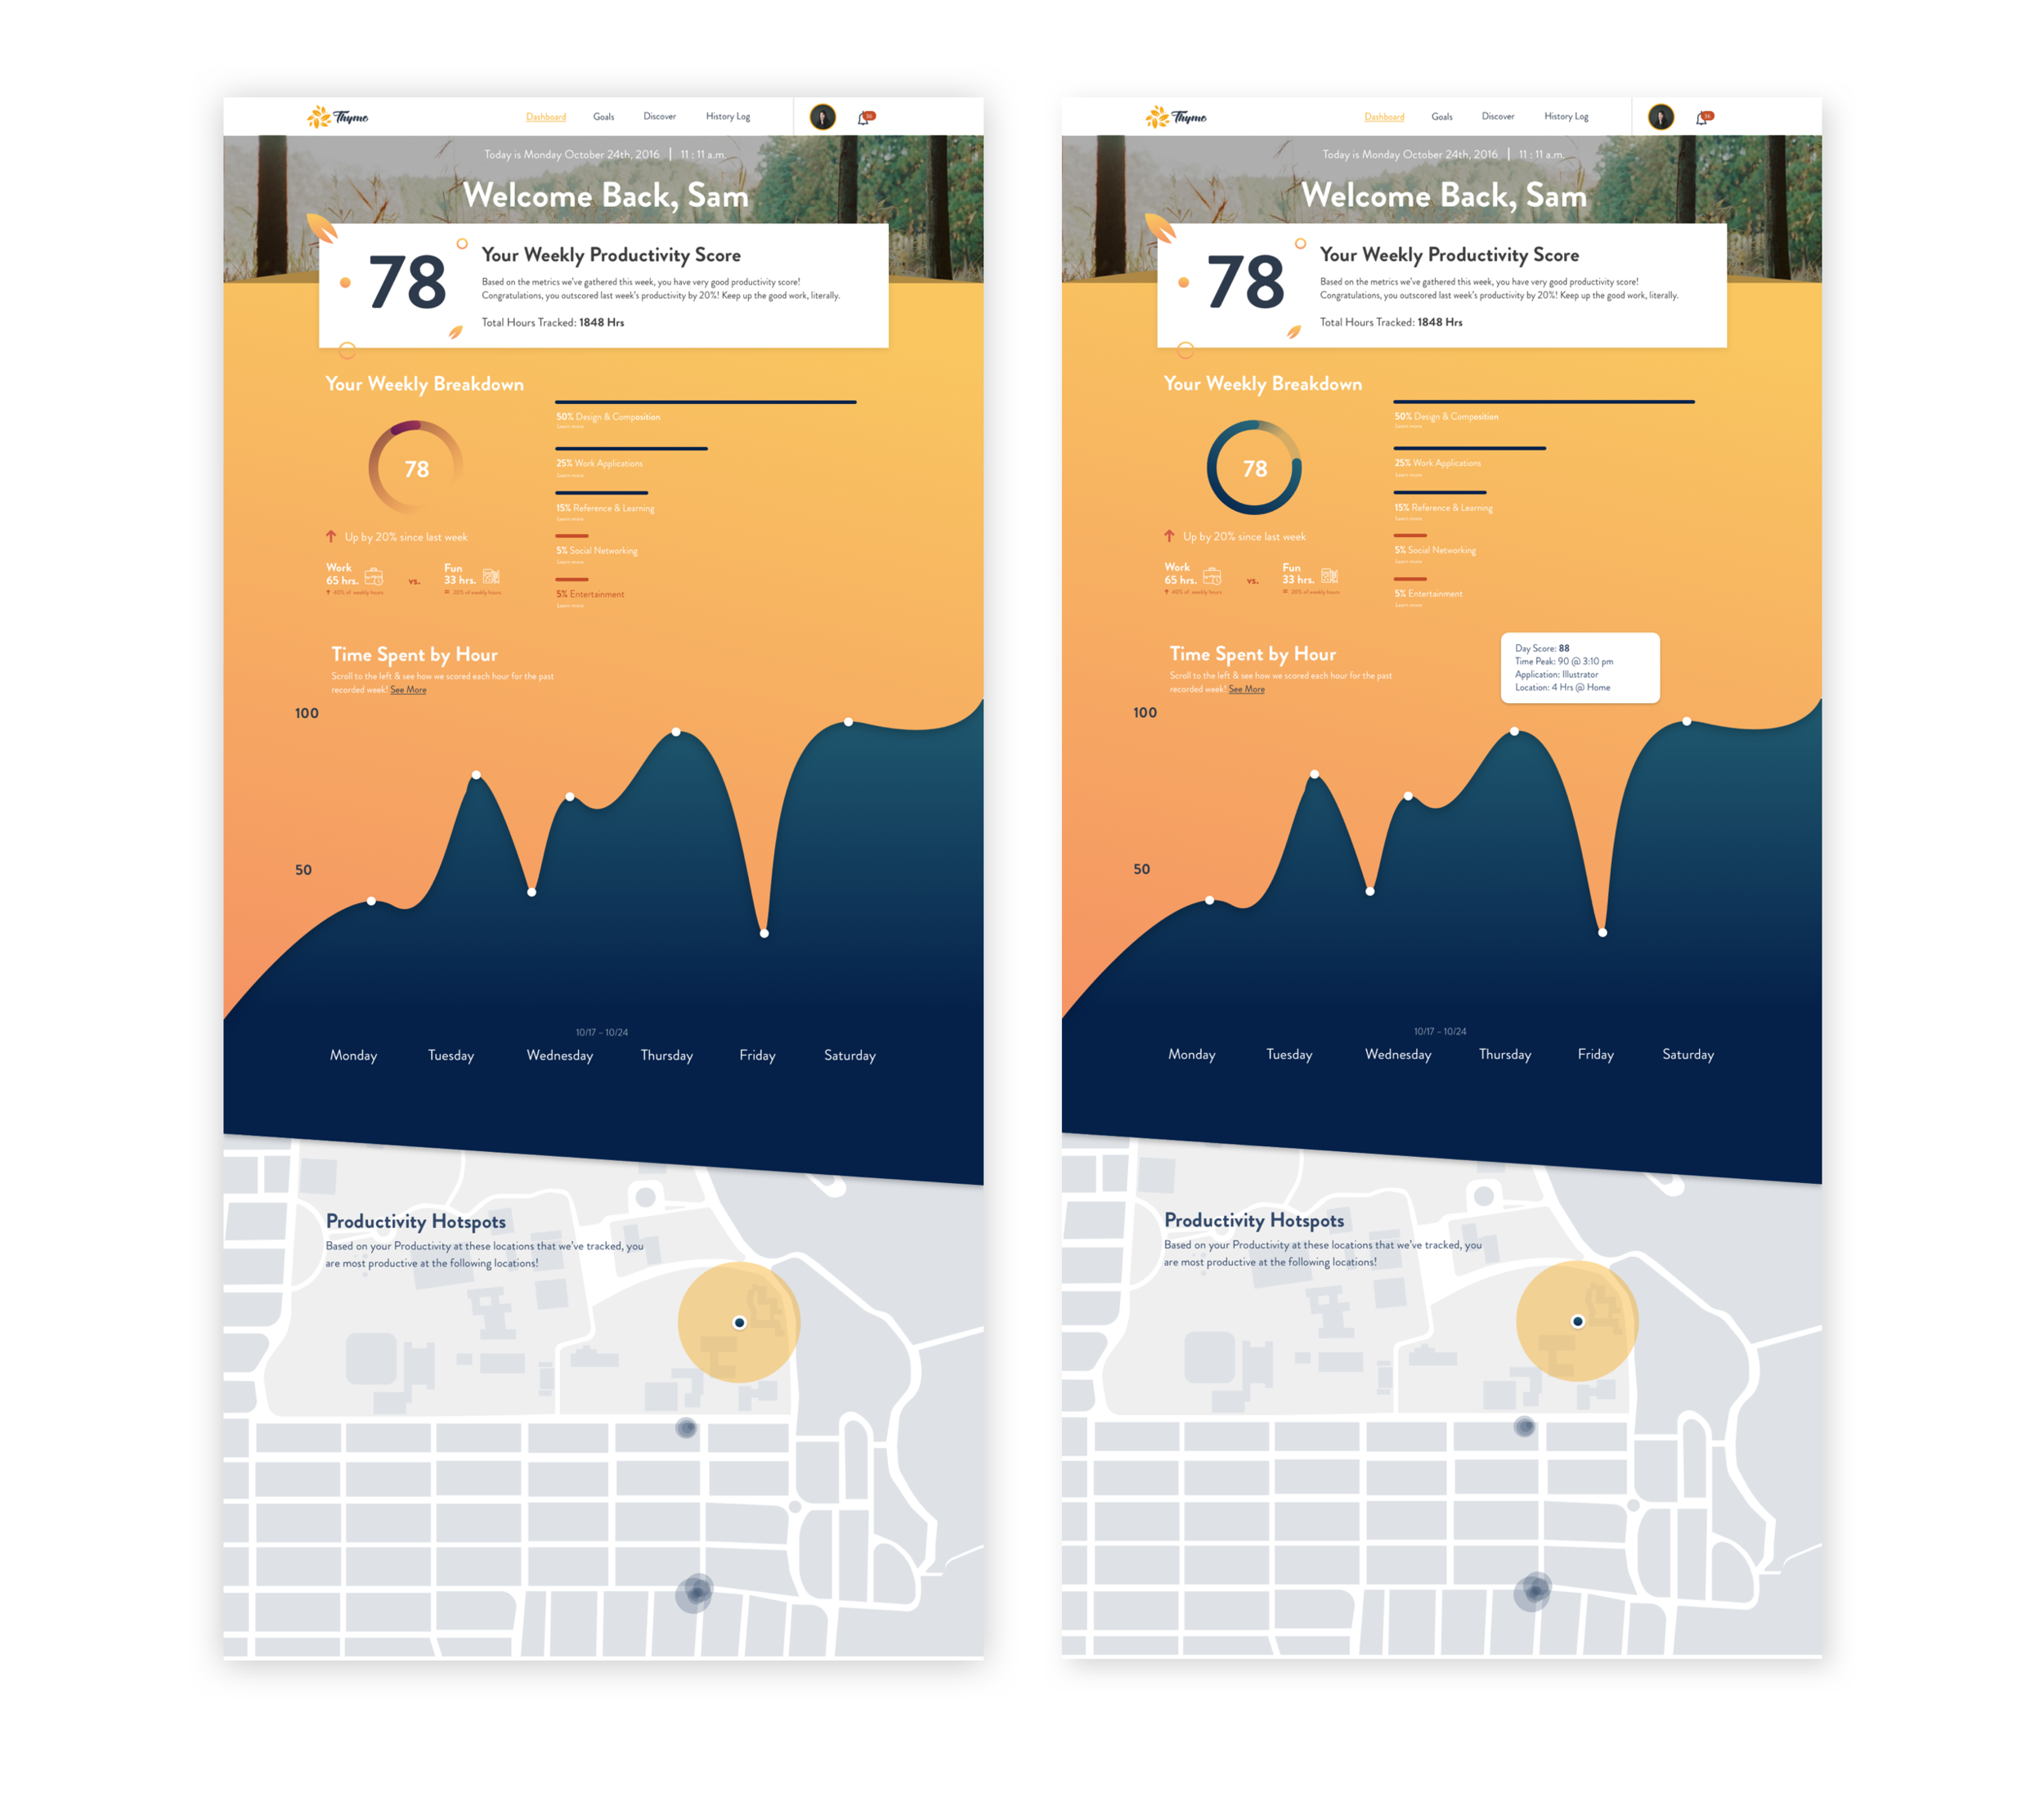
The dashboard was altered quite a bit, becoming longer with more relevant data placed at the beginning of the screen. The color to make it suit Cal students better, since that would become our target market. Also to clarify that red meant unproductive and blue meant productive, instead of red vs yellow in their first design.
The Weekly Productivity Score has more information on how we arrive at that number each time, using previous weekly information, current week, and other users information to aggregate a potential score.
The Weekly Breakdown has a hover activated percentage of how much time is spent on each task, categorizing each activity as either productive or unproductive, color coded blue v. red.
There is a side scroll & zoom under the Time Spent By Hour. Although here it only shows the scope of a week, it can function in sidescroll, zoom method much like a map to show the vast data points over time that Thyme accumulates. Each highlight shows peak points & low points of productivity, revealing what apps exactly were being used at that specific time, & where.
Productivity Hotspots give a broader overview that the later Discover page gives. It uses the information tracked at tracked locations to help the user understand which locations allow them to be most on task. This is meant as a first round design of an idea meant to be established more thoroughly.
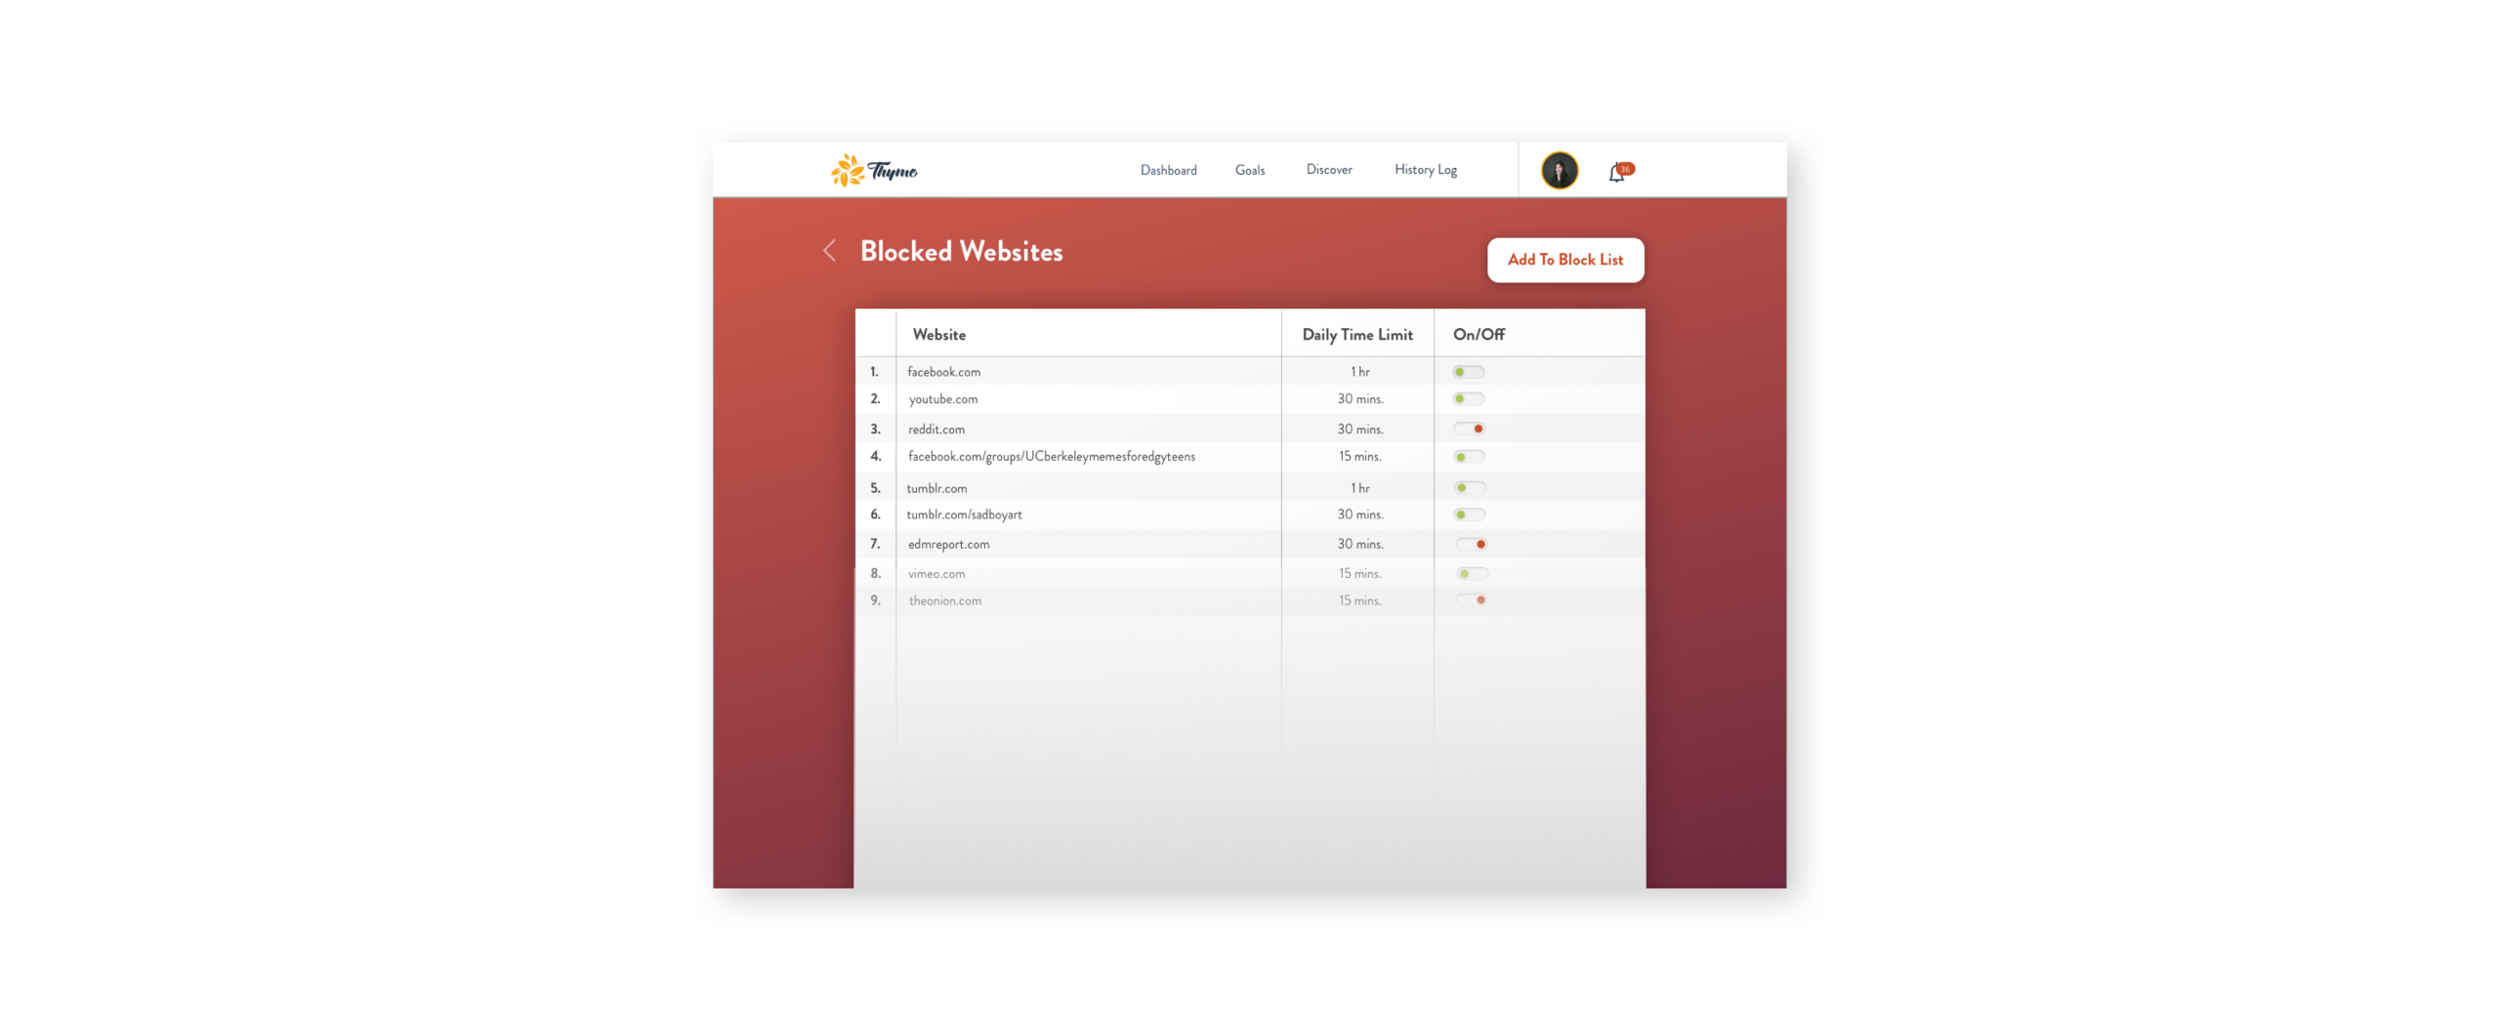
Blocked Websites
We added a utility page for users to manage their blocked website settings. There are simple settings for daily timers when reaching limits that the user can set to receive push notifications on their main devices. Also it classifies websites as unproductive using the systems data, unless the user decides to change it’s categorization to productive.
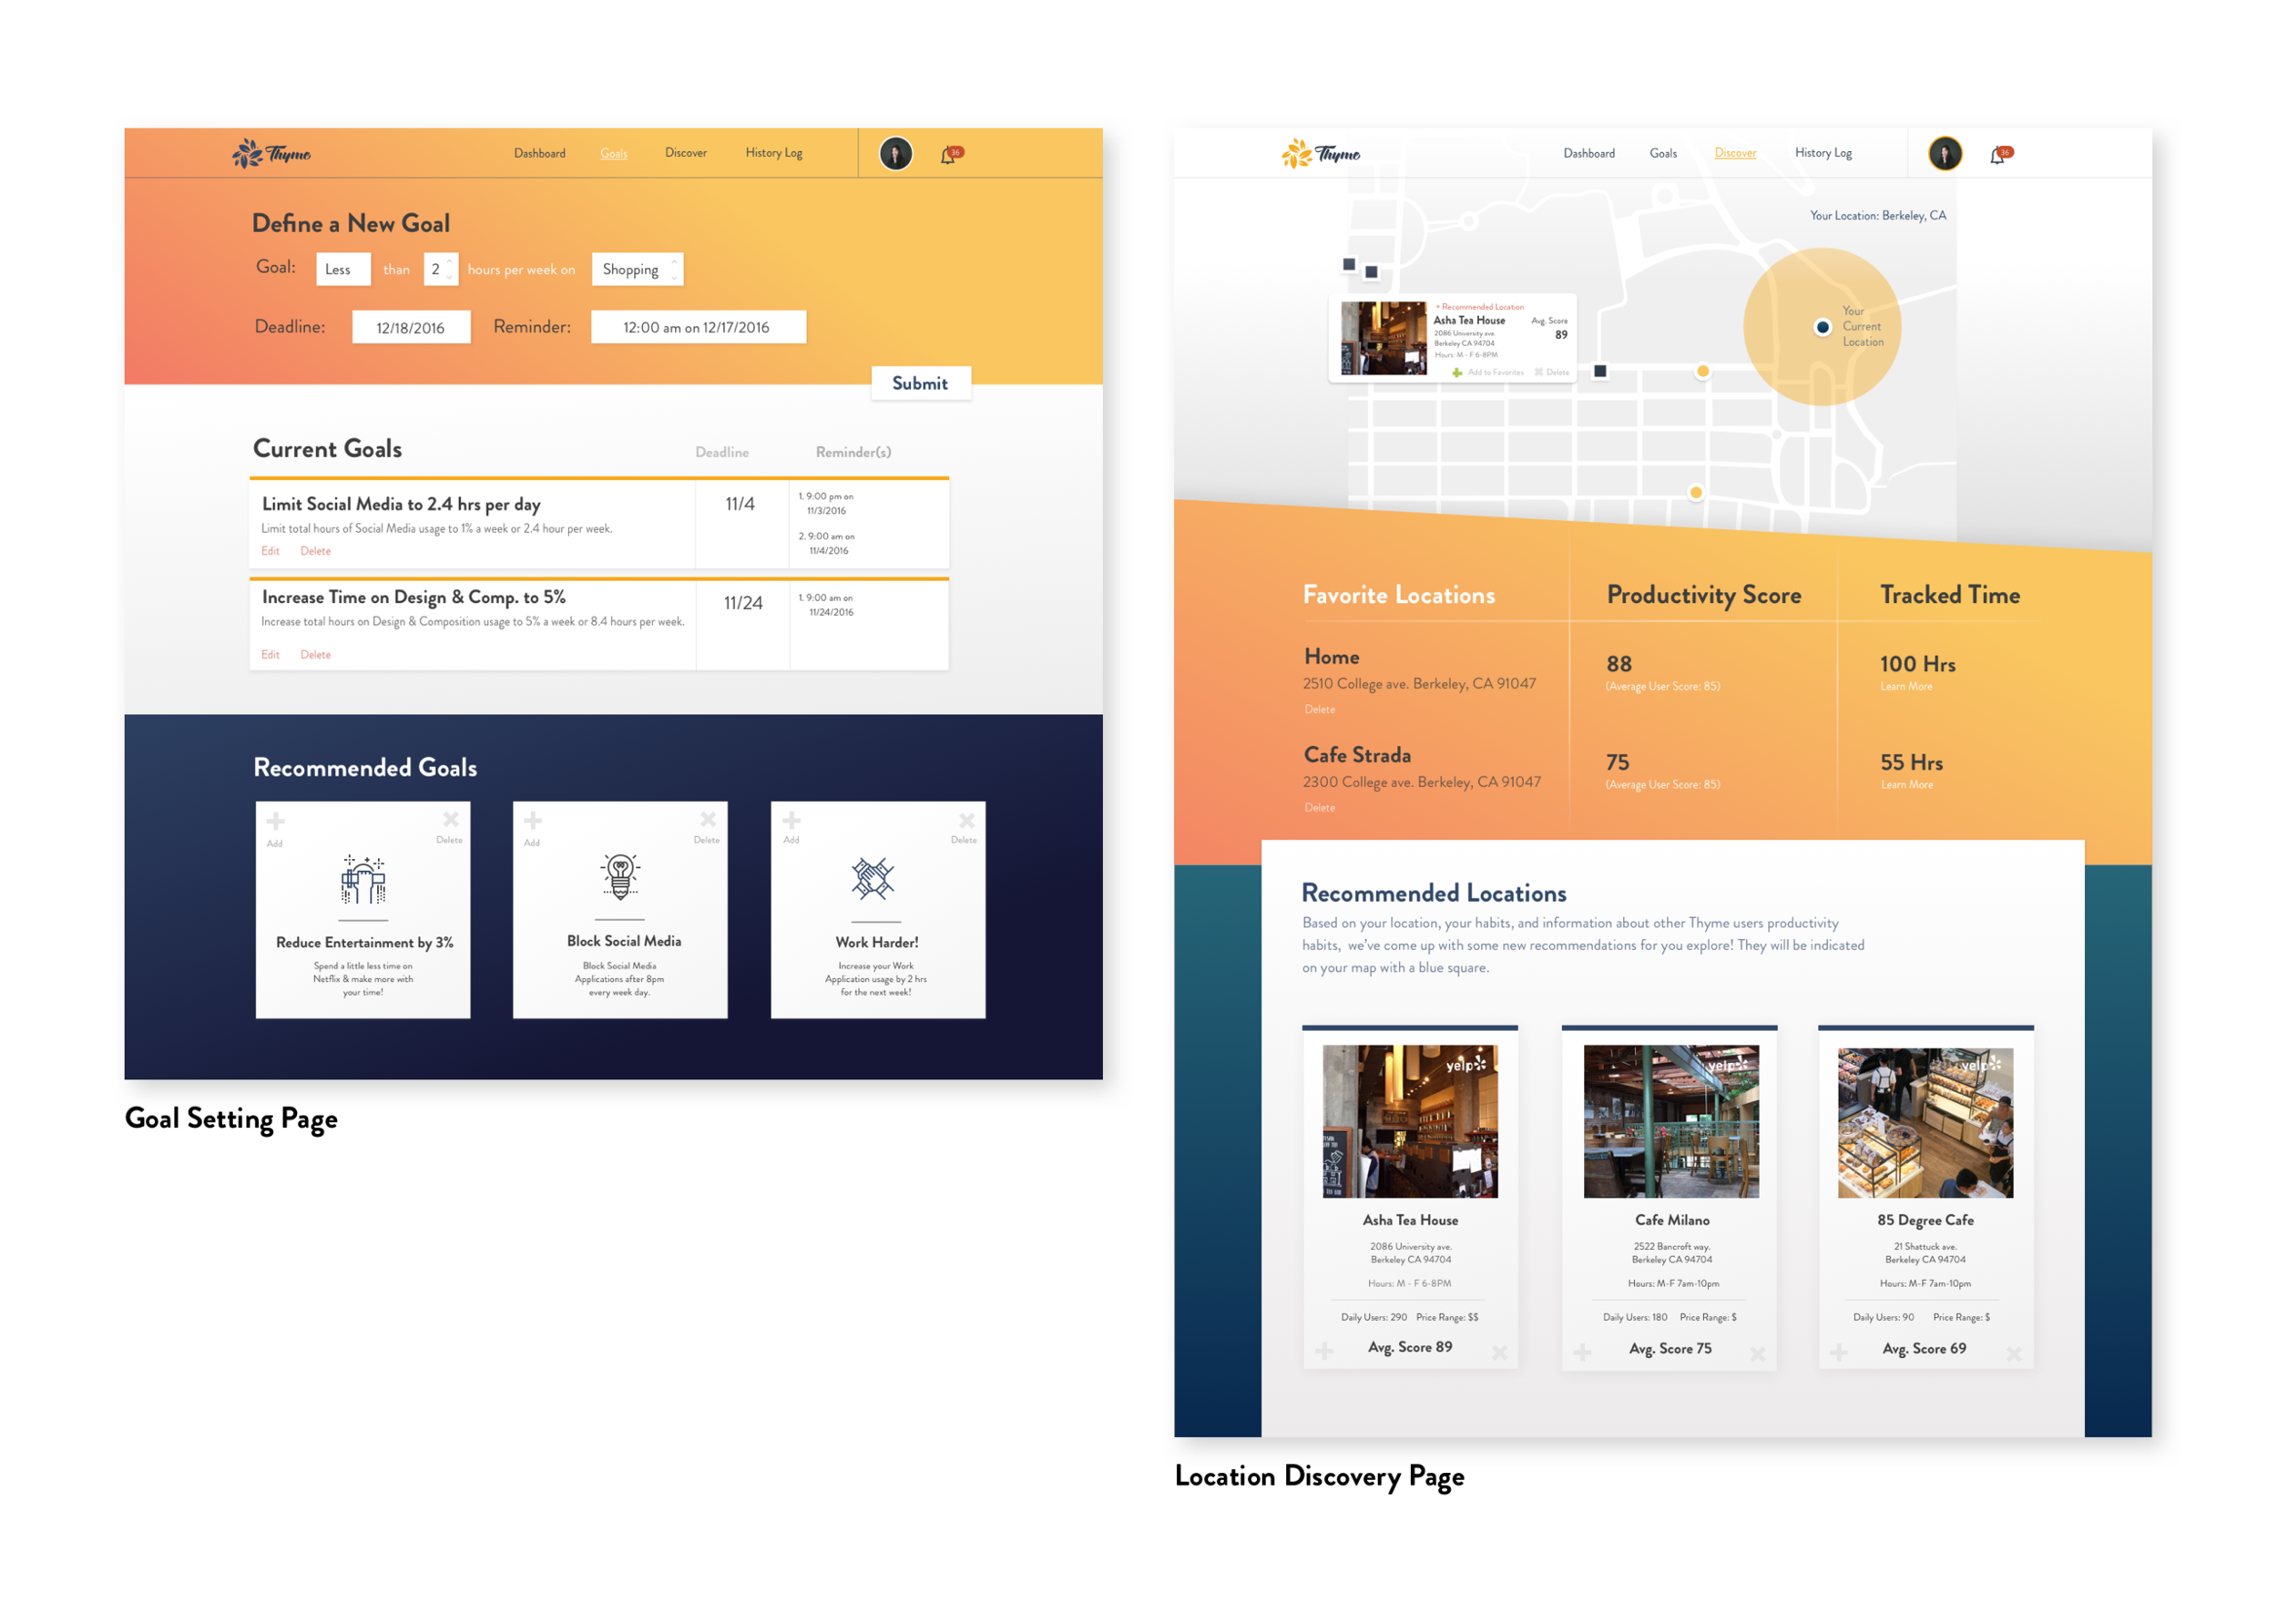
Goal Setting & Location Discovery
For our main navigation pages we greatly reduced the amount of information on each page, making the key elements per page clearer, while adding insights on clickable areas and other relevant information on hover areas, such as the map.
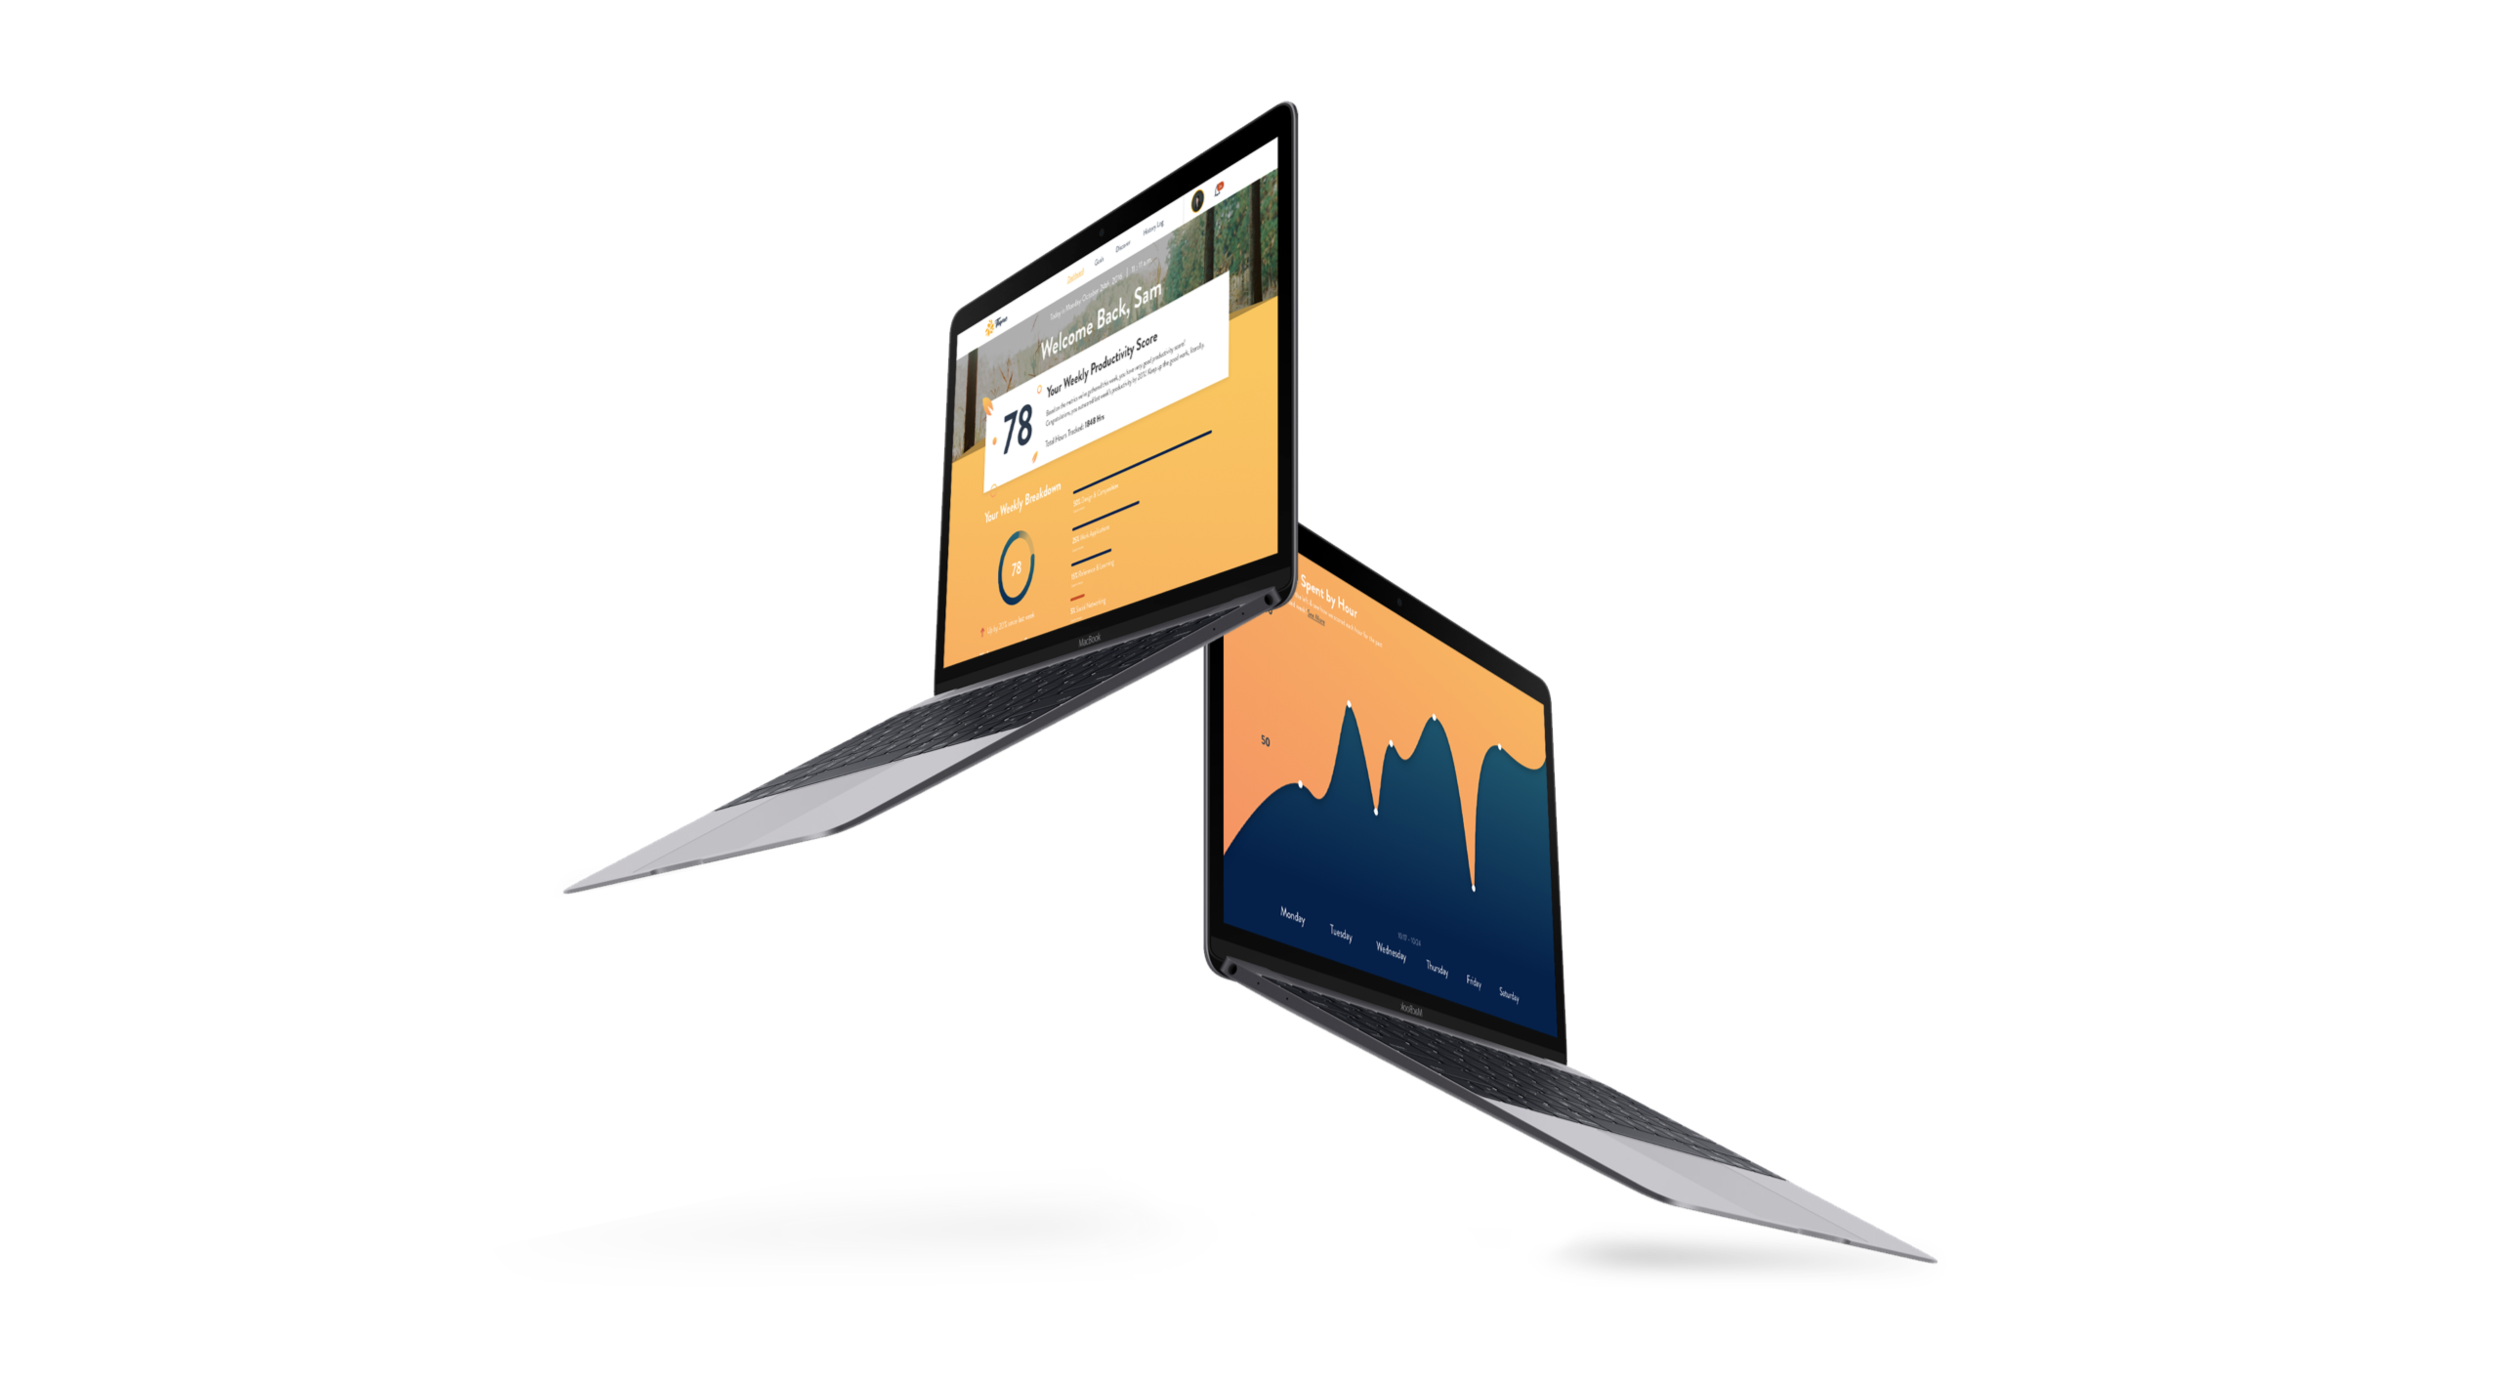
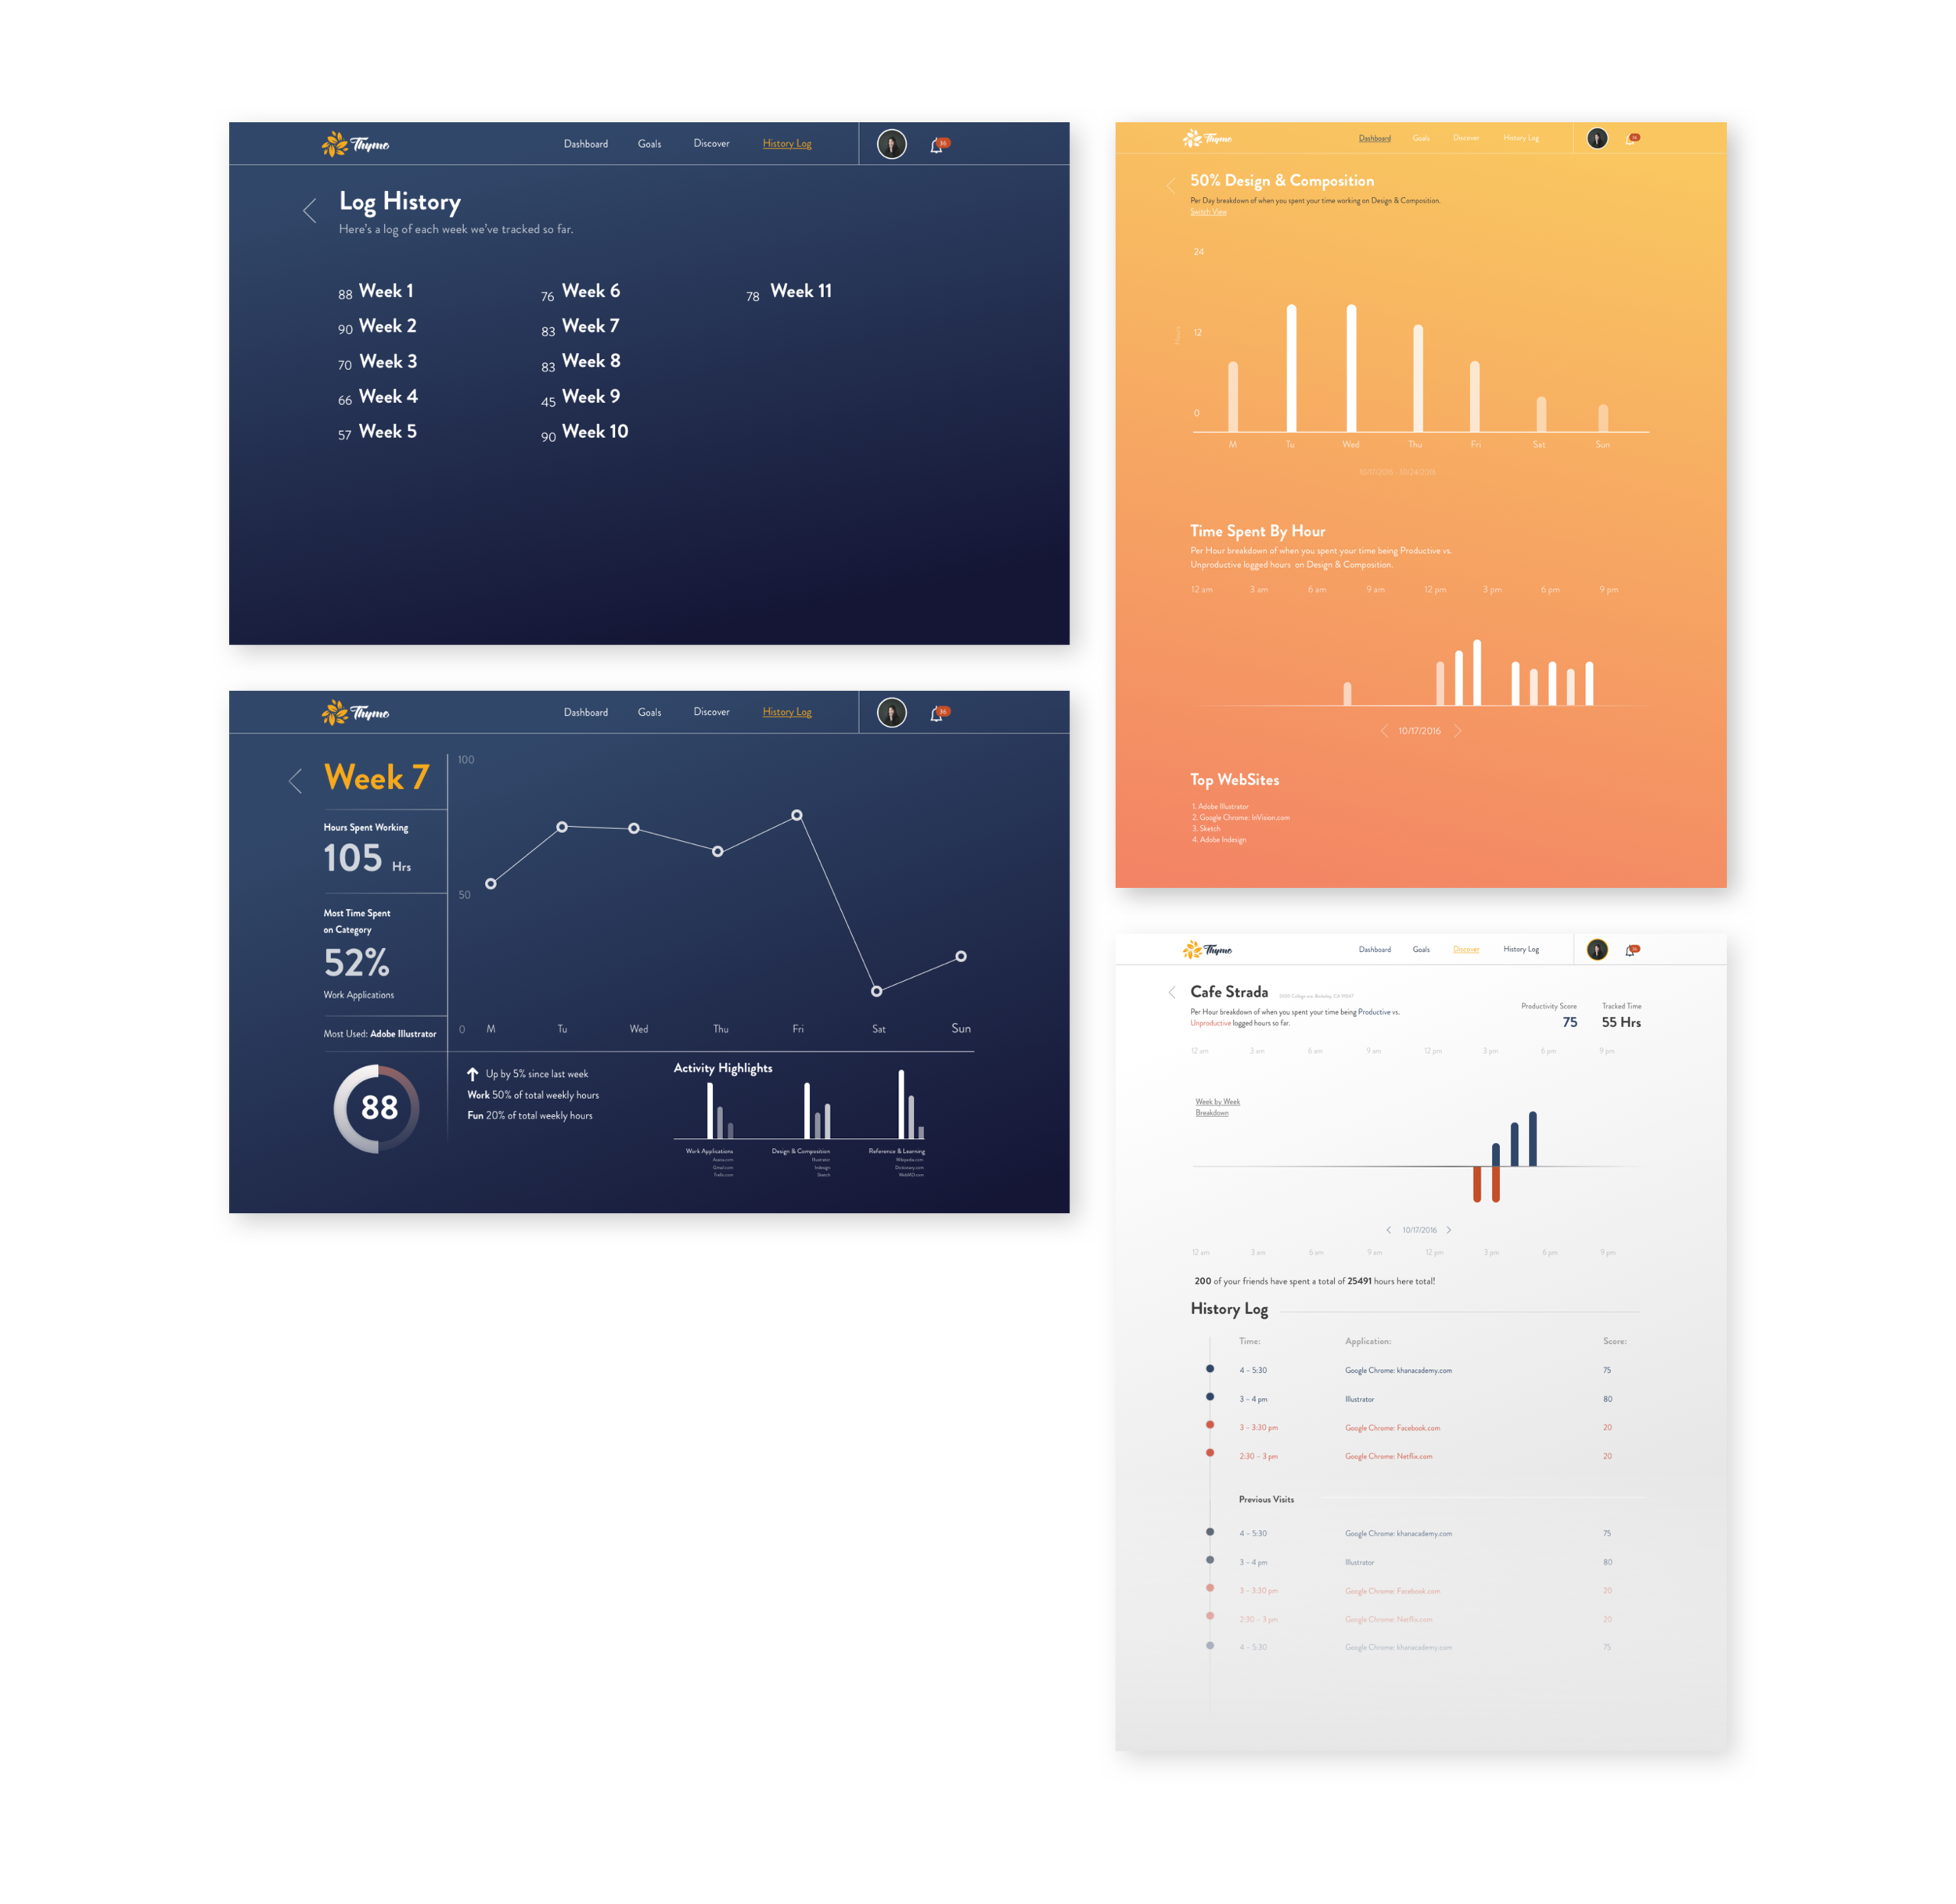
More Insights
One of the most important factors we discovered from our user research revealed that potential users wanted more breakdowns of their data, how exactly their time & how their productivity fluctated based on locations & time of day. Here we have an overview of some of the new information we included in our final draft, hoping to show the value of our product relies heavily on useful data over time, with access to different metrics .
Final Pitch
At the end of the class we pitched to our professor Ken Sandy & a few designers at notable tech companies in the Bay Area.
In our class we won 1st place in People's Choice twice & 2nd Place in Instructor's Choice.
Below you can view our Final Pitch Presentation:

Revisiting
Realizing much of the previous semester had rushed the design process of our product. I decided to return to the original concept, recreating from the previous the design a more fitting, responsive, & cohesive application.

Idea
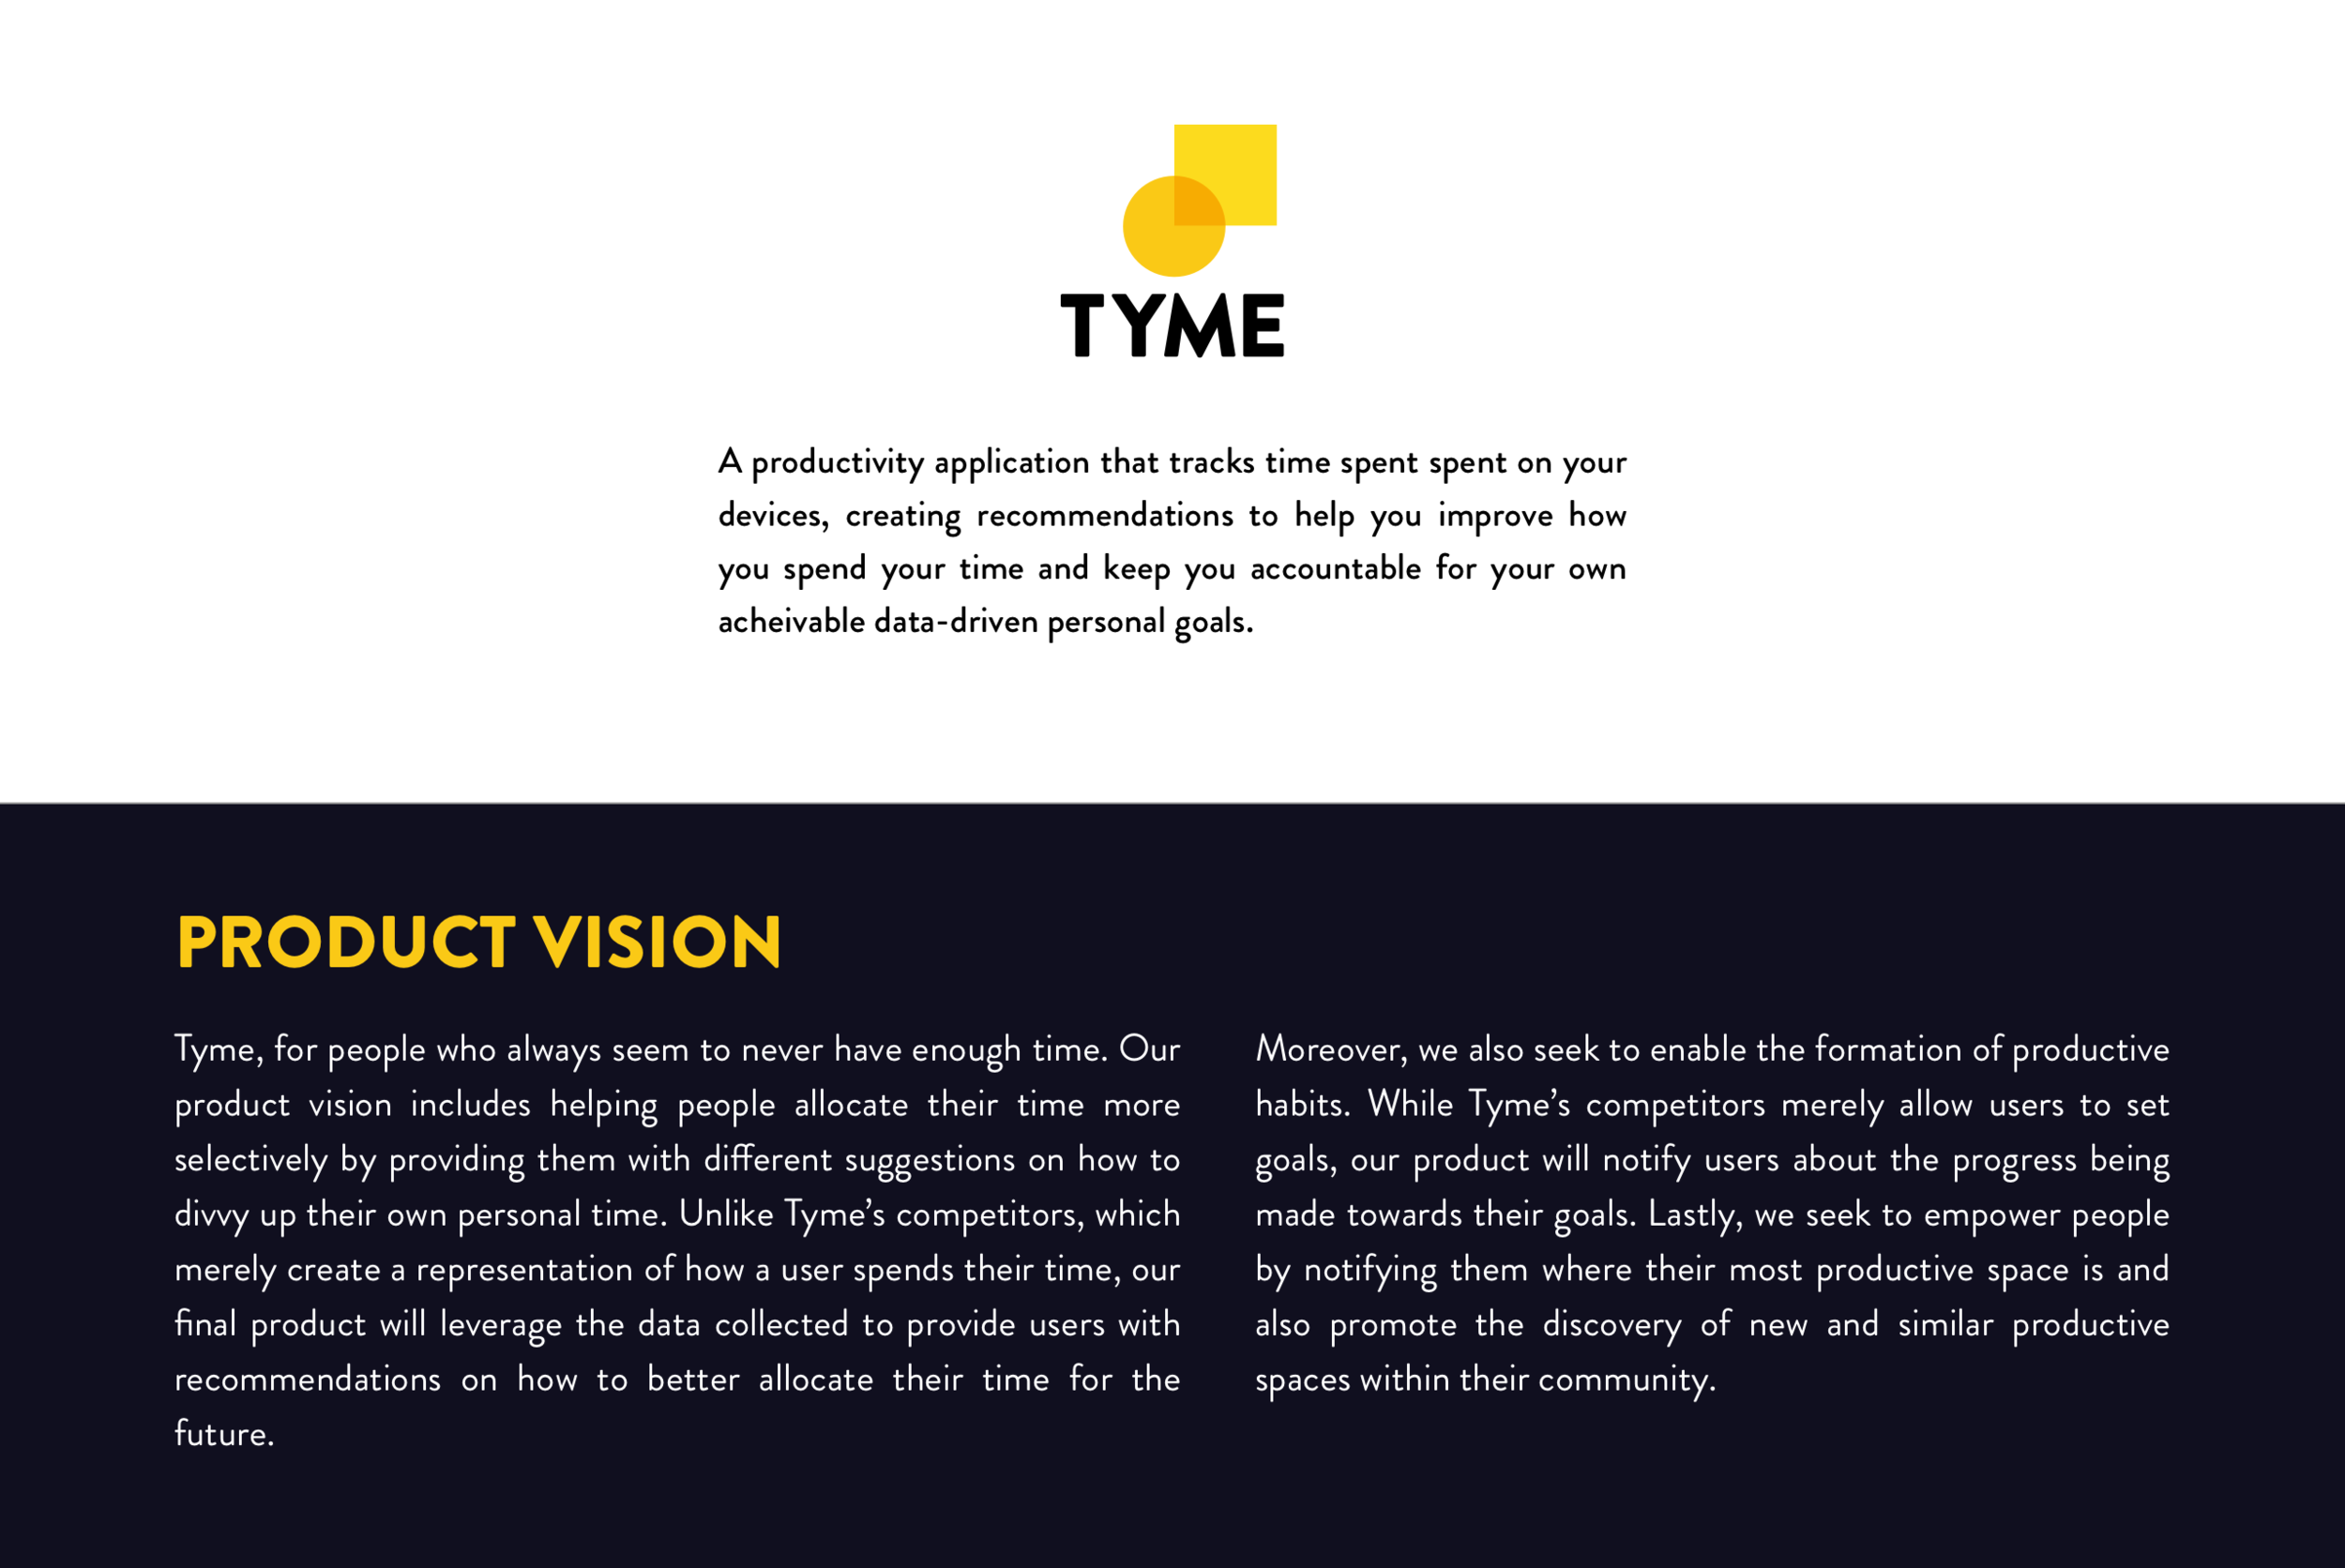
Originally we developed the idea of having a cute name of Thyme, which originated from other companies often having cute names that were synonyms or held a small connection to the company's actual product/values. Instead I wanted to shift away from that, as Thyme was assumed to be a cooking product to a number of people reviewing the application. Here I developed a values system based on geometric shapes to represent the three main offerings of Tyme.
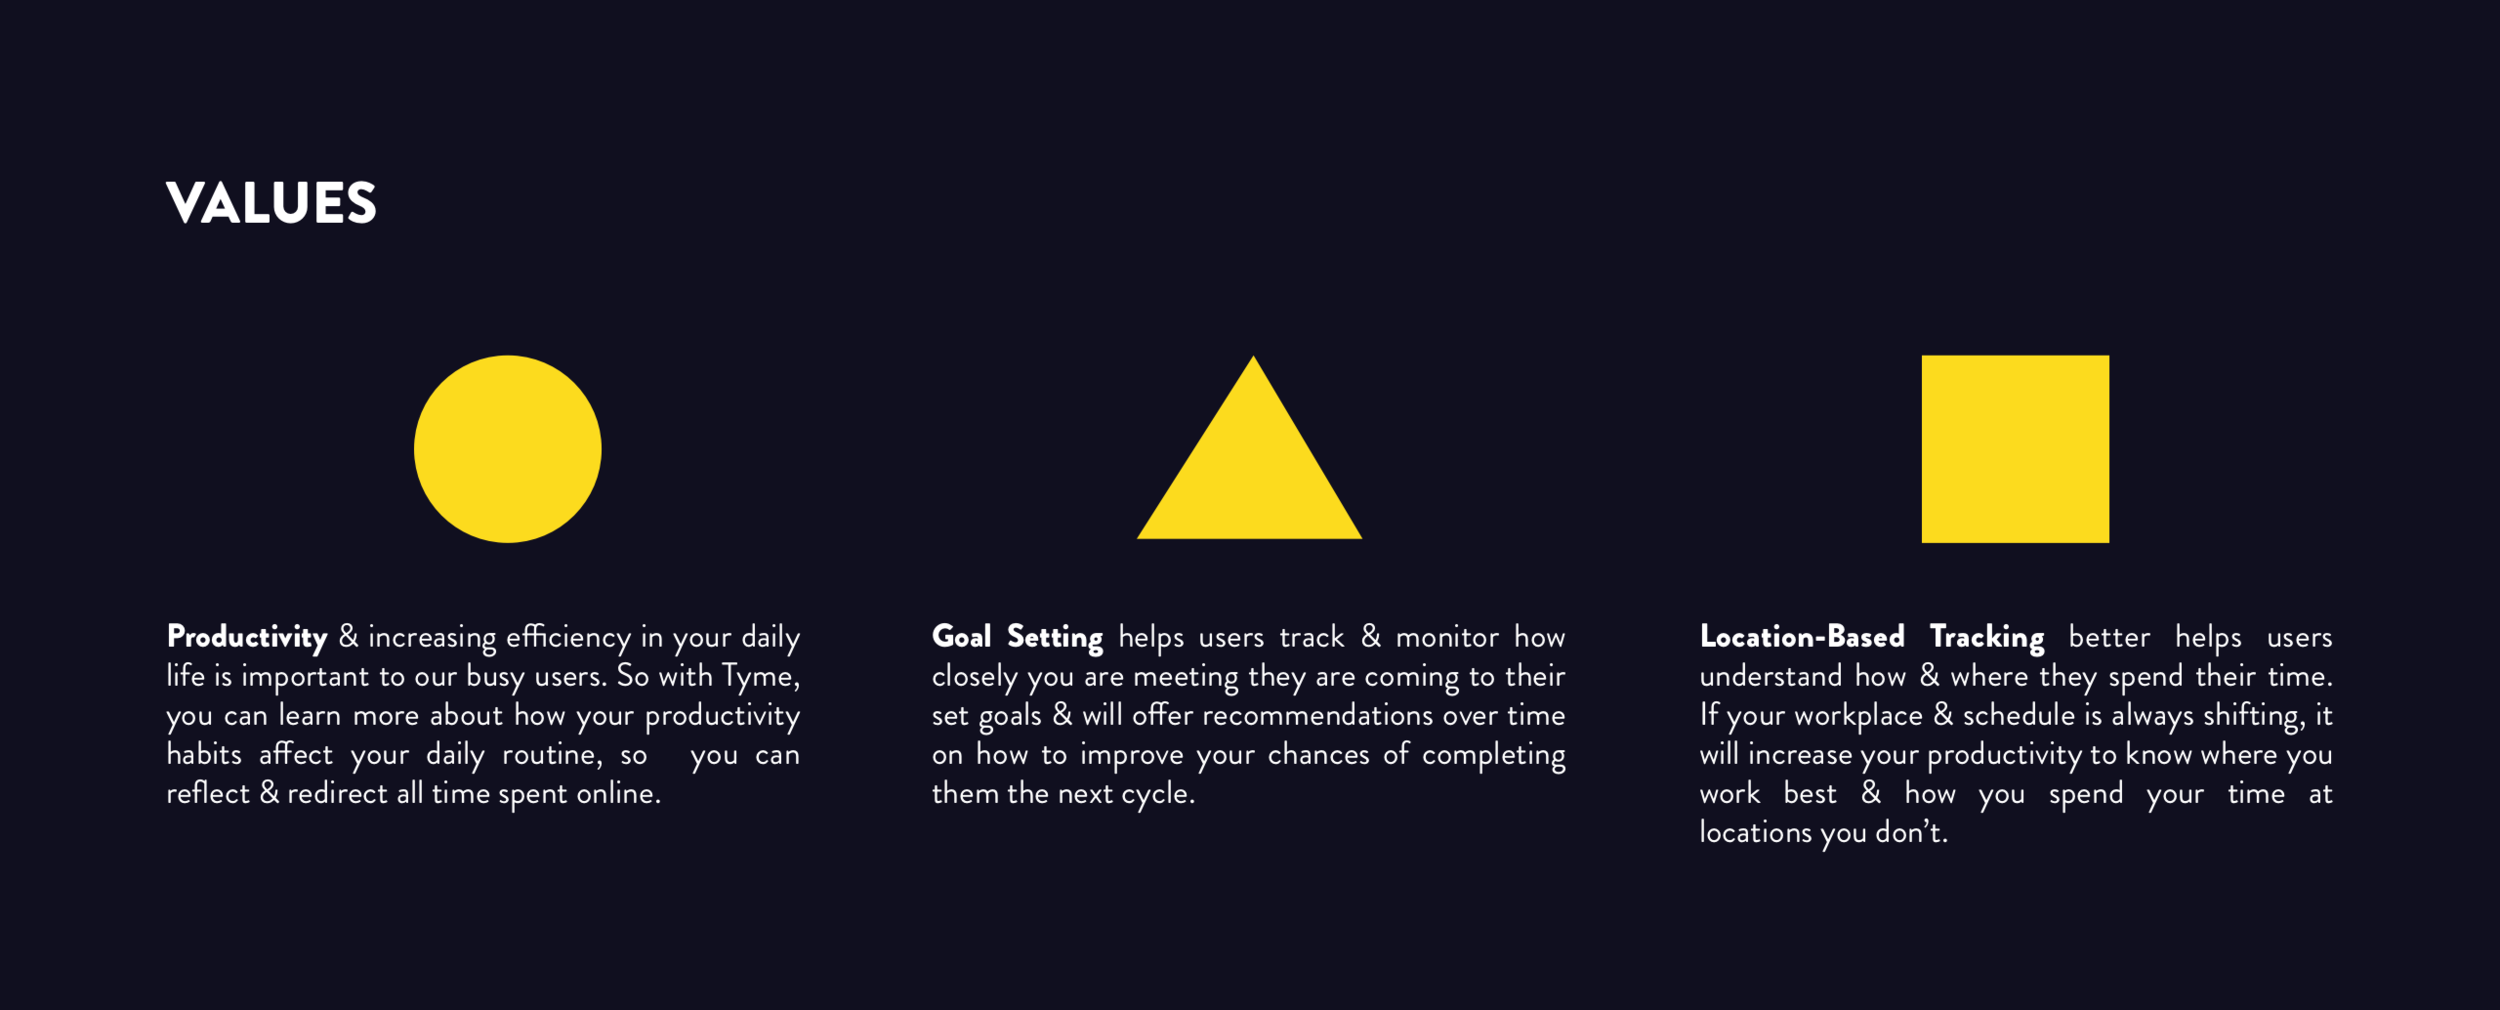
These shapes played well with visual design elements & multiply layering.
Style Decisions
I wanted a color pattern that style resembled the previous iteration of thyme, paying homage to the original colors & features that it provided, while providing a style that would allow for cleaner, clearer, & more abstract visual purpose. By using circles, triangles, & squares I am able to achieve numerous combinations to create the purposeful & meaningful visual elements that creates a brand identity.
Likewise, it pairs well with the originally gorgeous font of Brandon Grotesque, yet instead opting for Brandon Black instead of Brandon Bold throughout most of the design.
Web Application & Sketching Prototypes
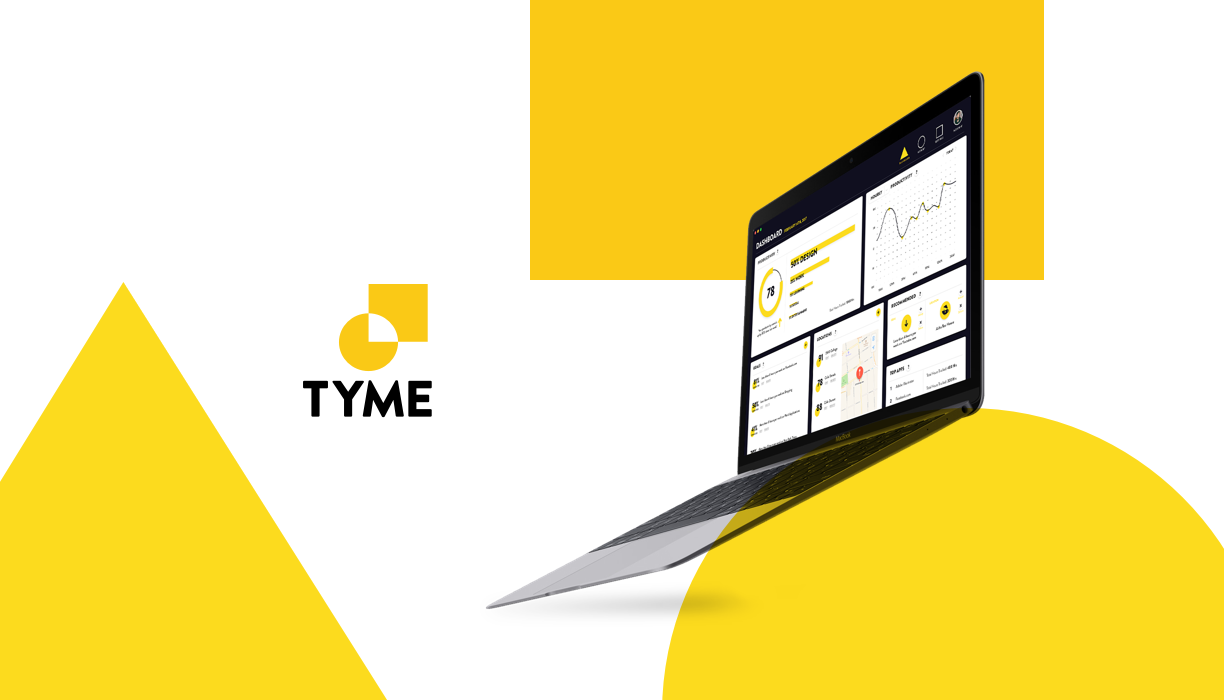
Taking into all of the previous information regarding our web application, I decided to turn our time-tracker into a computer based, re-sizeable application. I wanted it to be modular so that it could reformat into different sizes, if given more time in designing for a responsive layout.
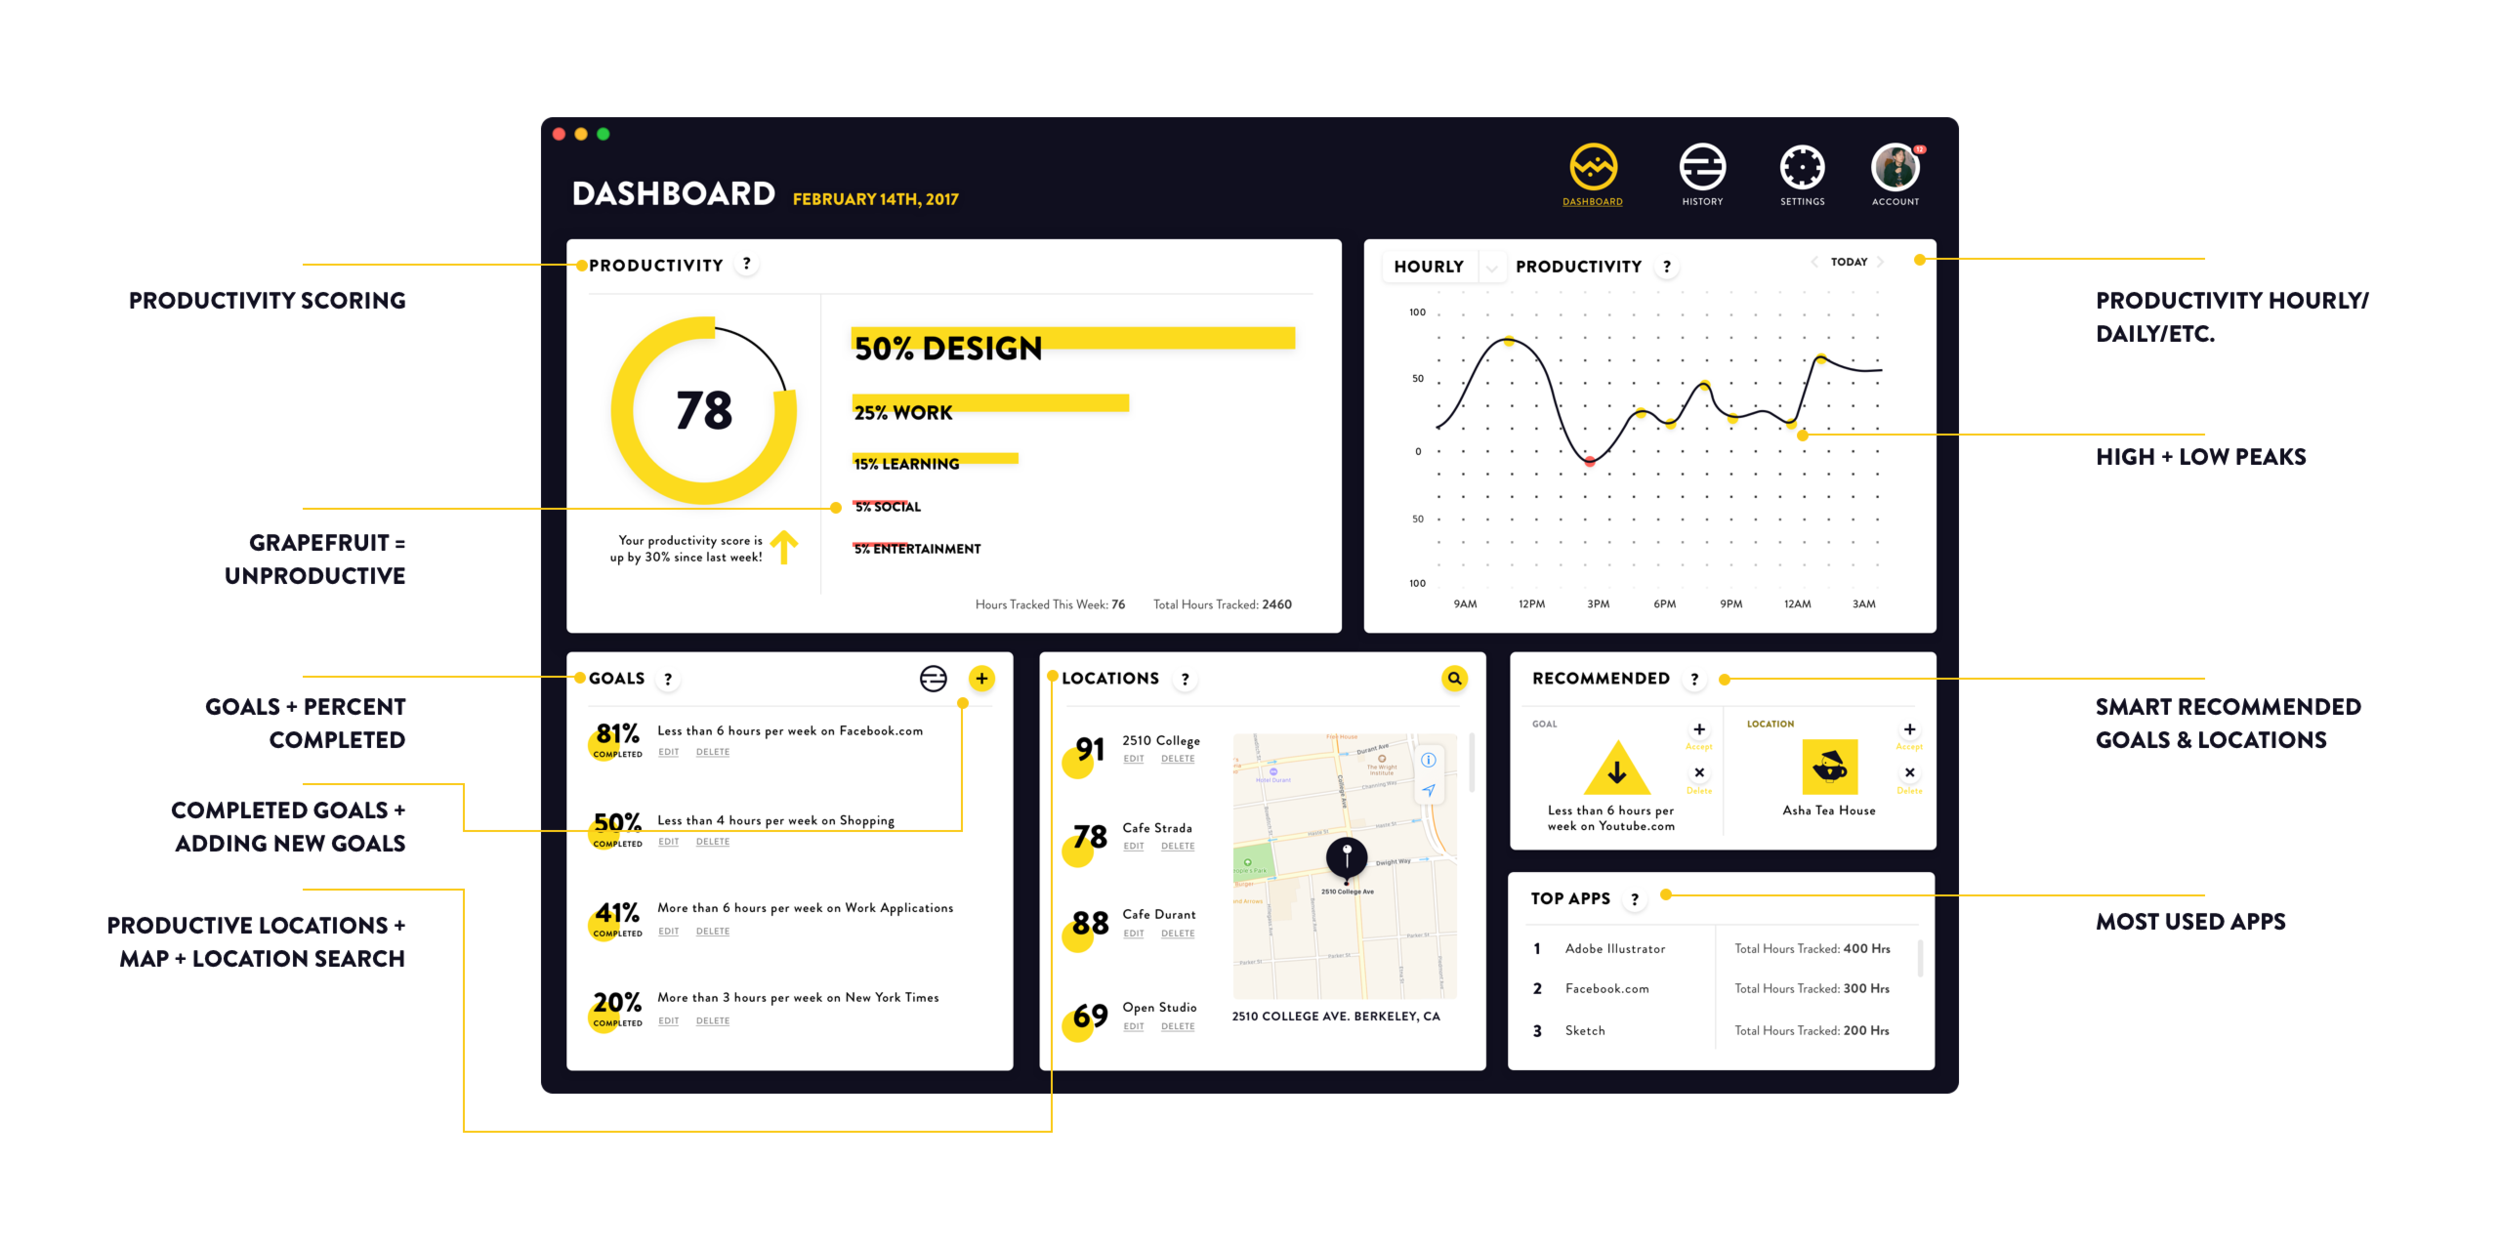
Dashboard
The dashboard is different from the previous iteration, as it now fully contains the most pertinent information about goals, locations & productivity for that given week within one standalone screen. Each box is able to interact on its own, allowing the user to interact with the application without jumping between numerous screens
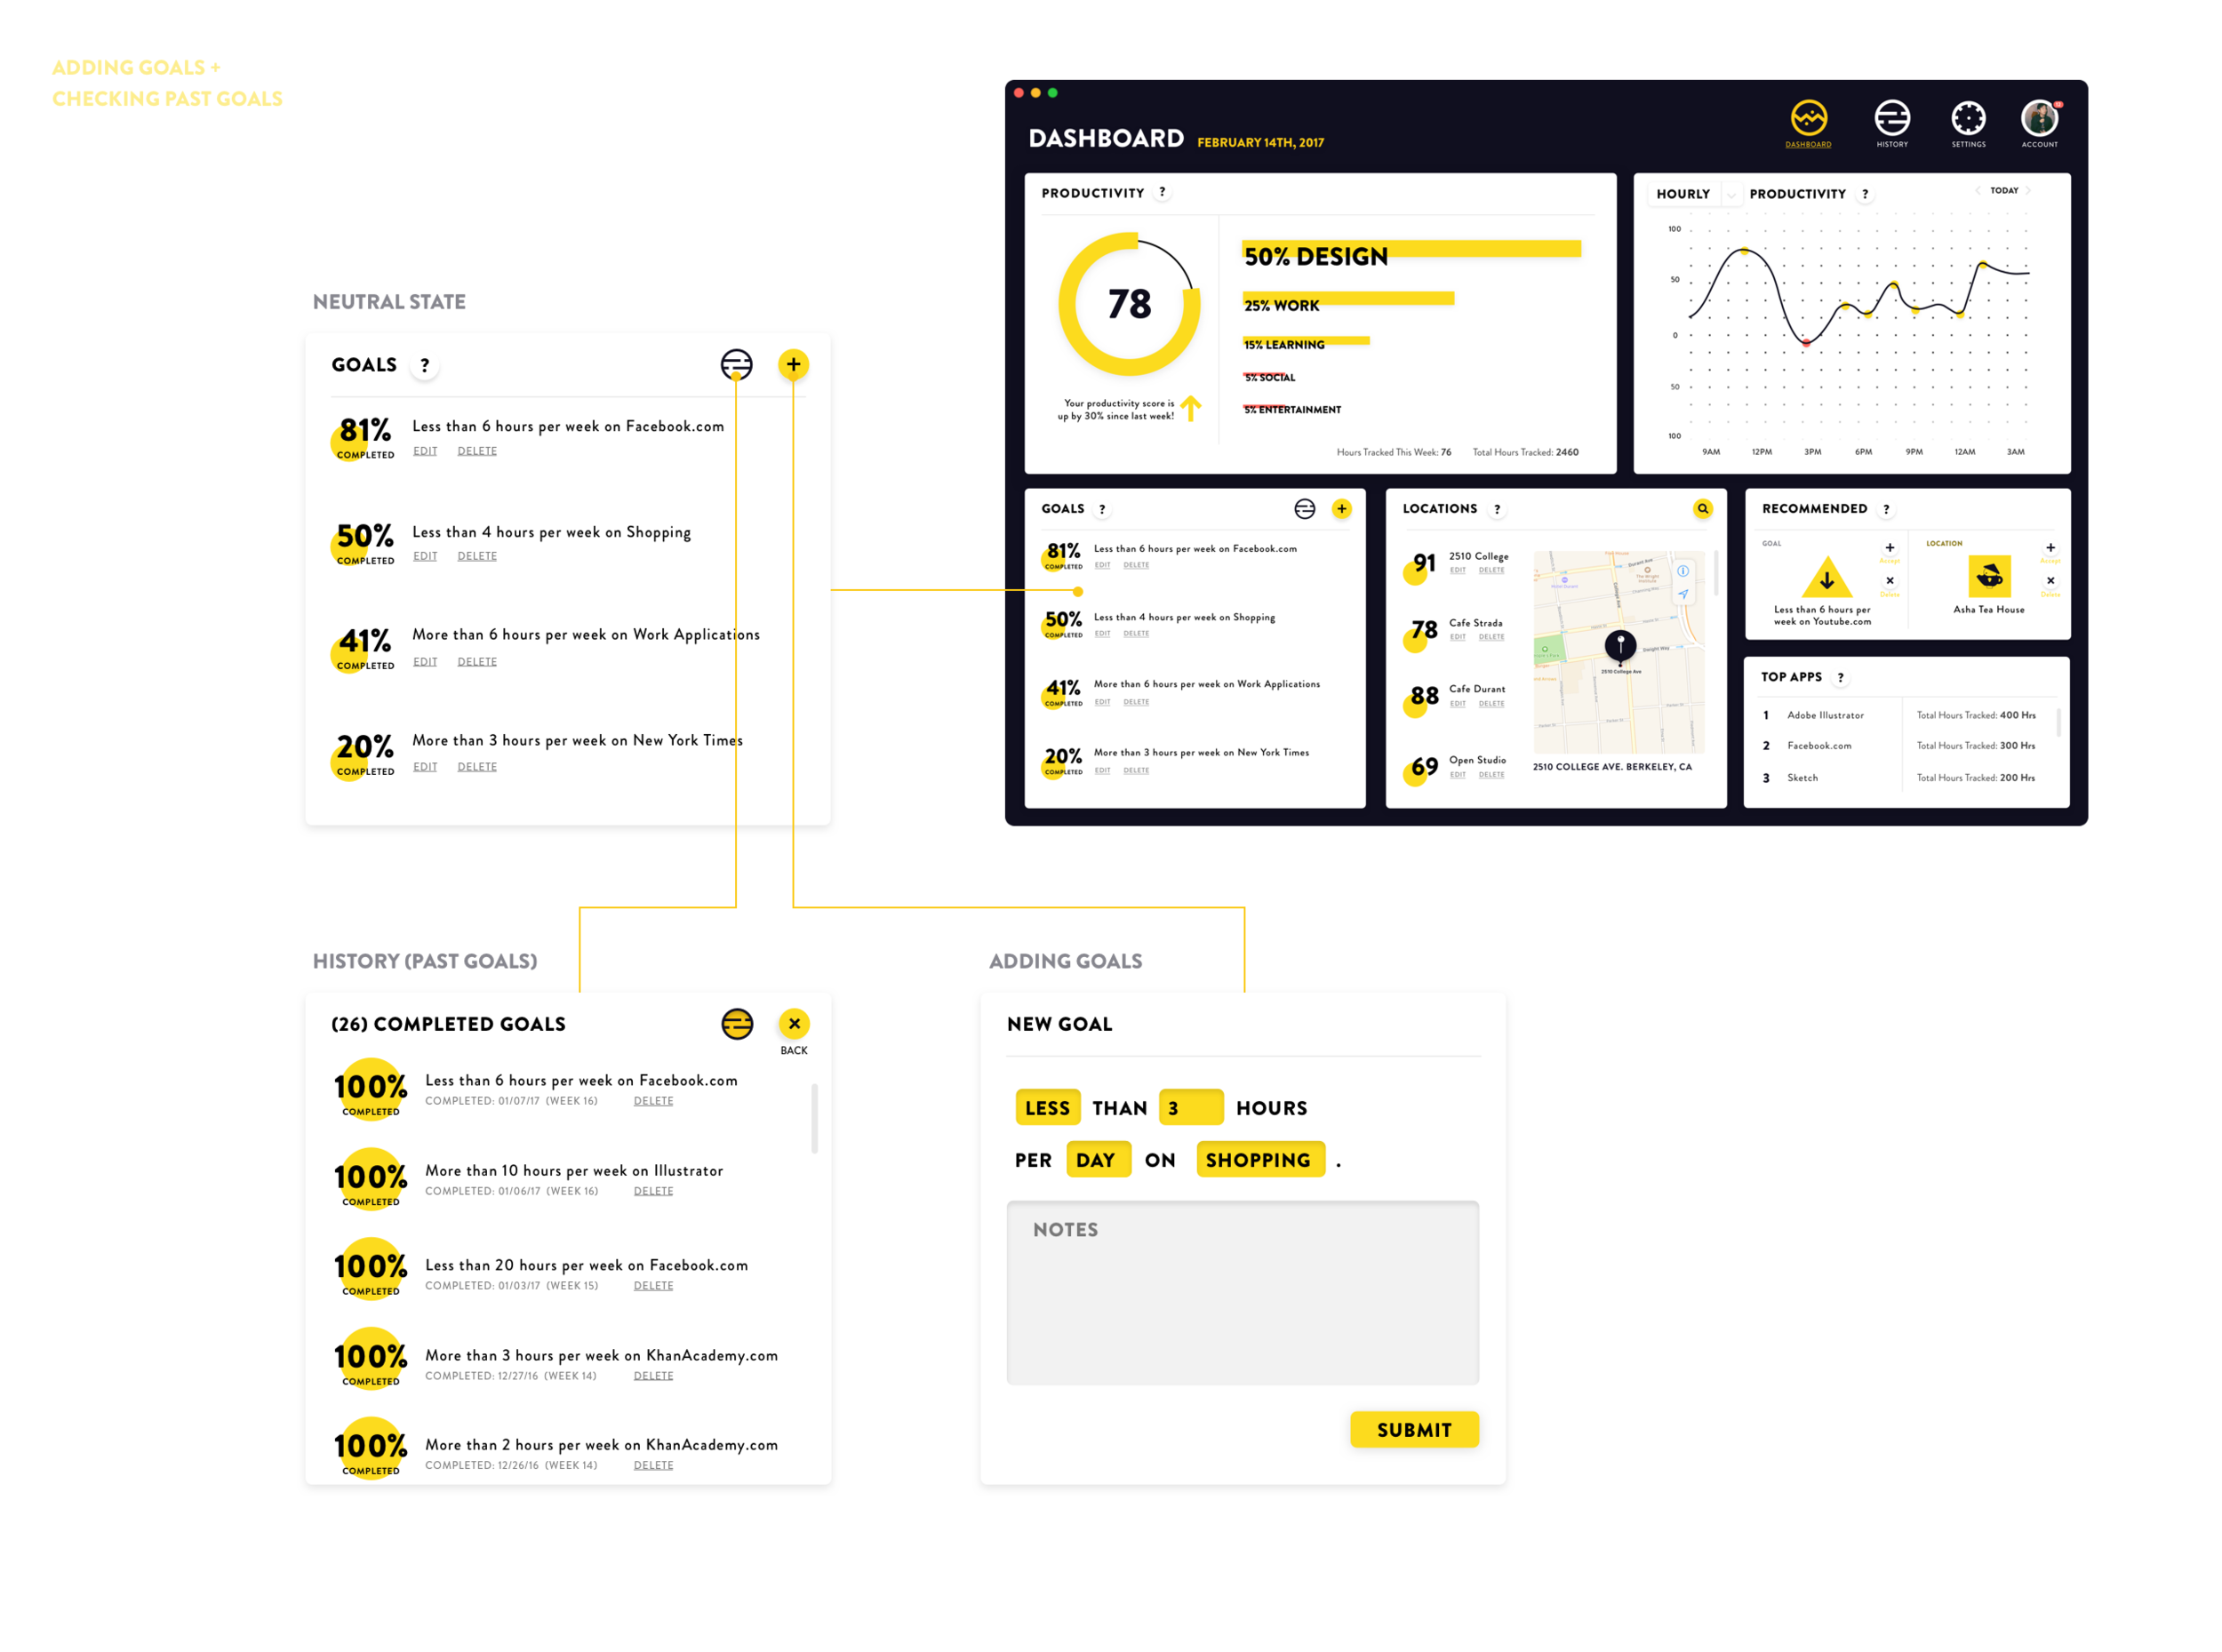
Setting Goals & History of Completed Goals
One of the distinct improvements in having this modular layout for the application, you can change the state of the boxes themselves without having to reload the entire screen. Here we see the entering of a new goal vs. the history of past goals all being contained within a single modular box within the larger screen.
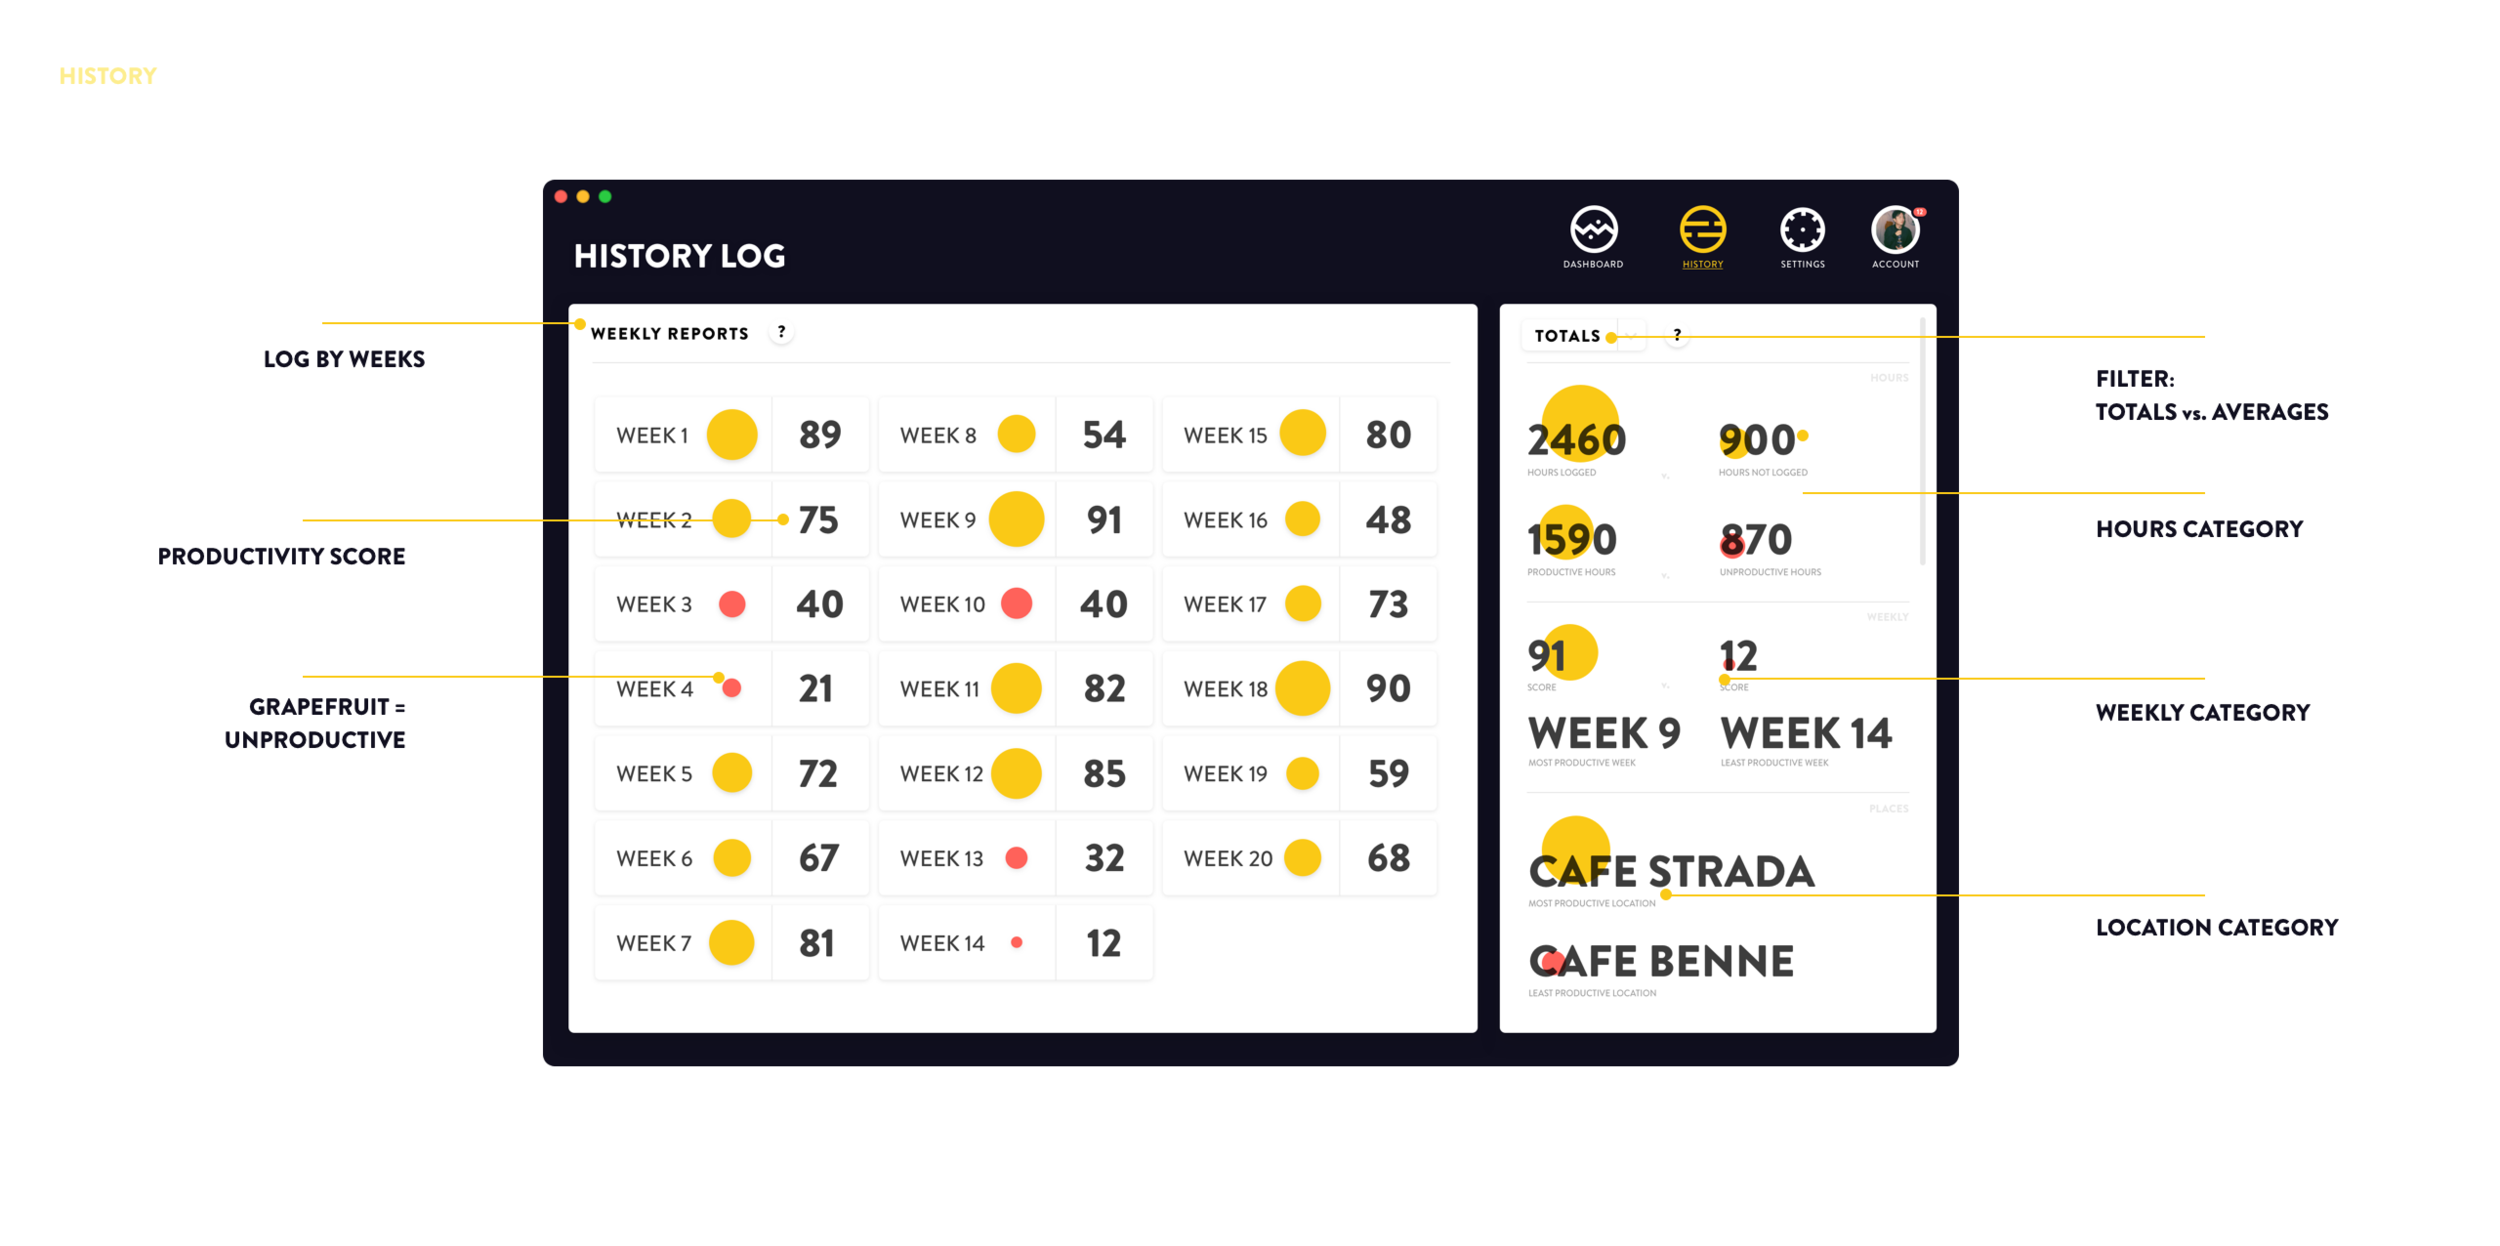
HISTORY LOG
A visual history log that shows larger, color based circles beside large numbers to help users understand how their weeks have progressed in terms of productivity in relation to one another.
The totals & averages give summaries of hourly, weekly, & location based figures for the user.
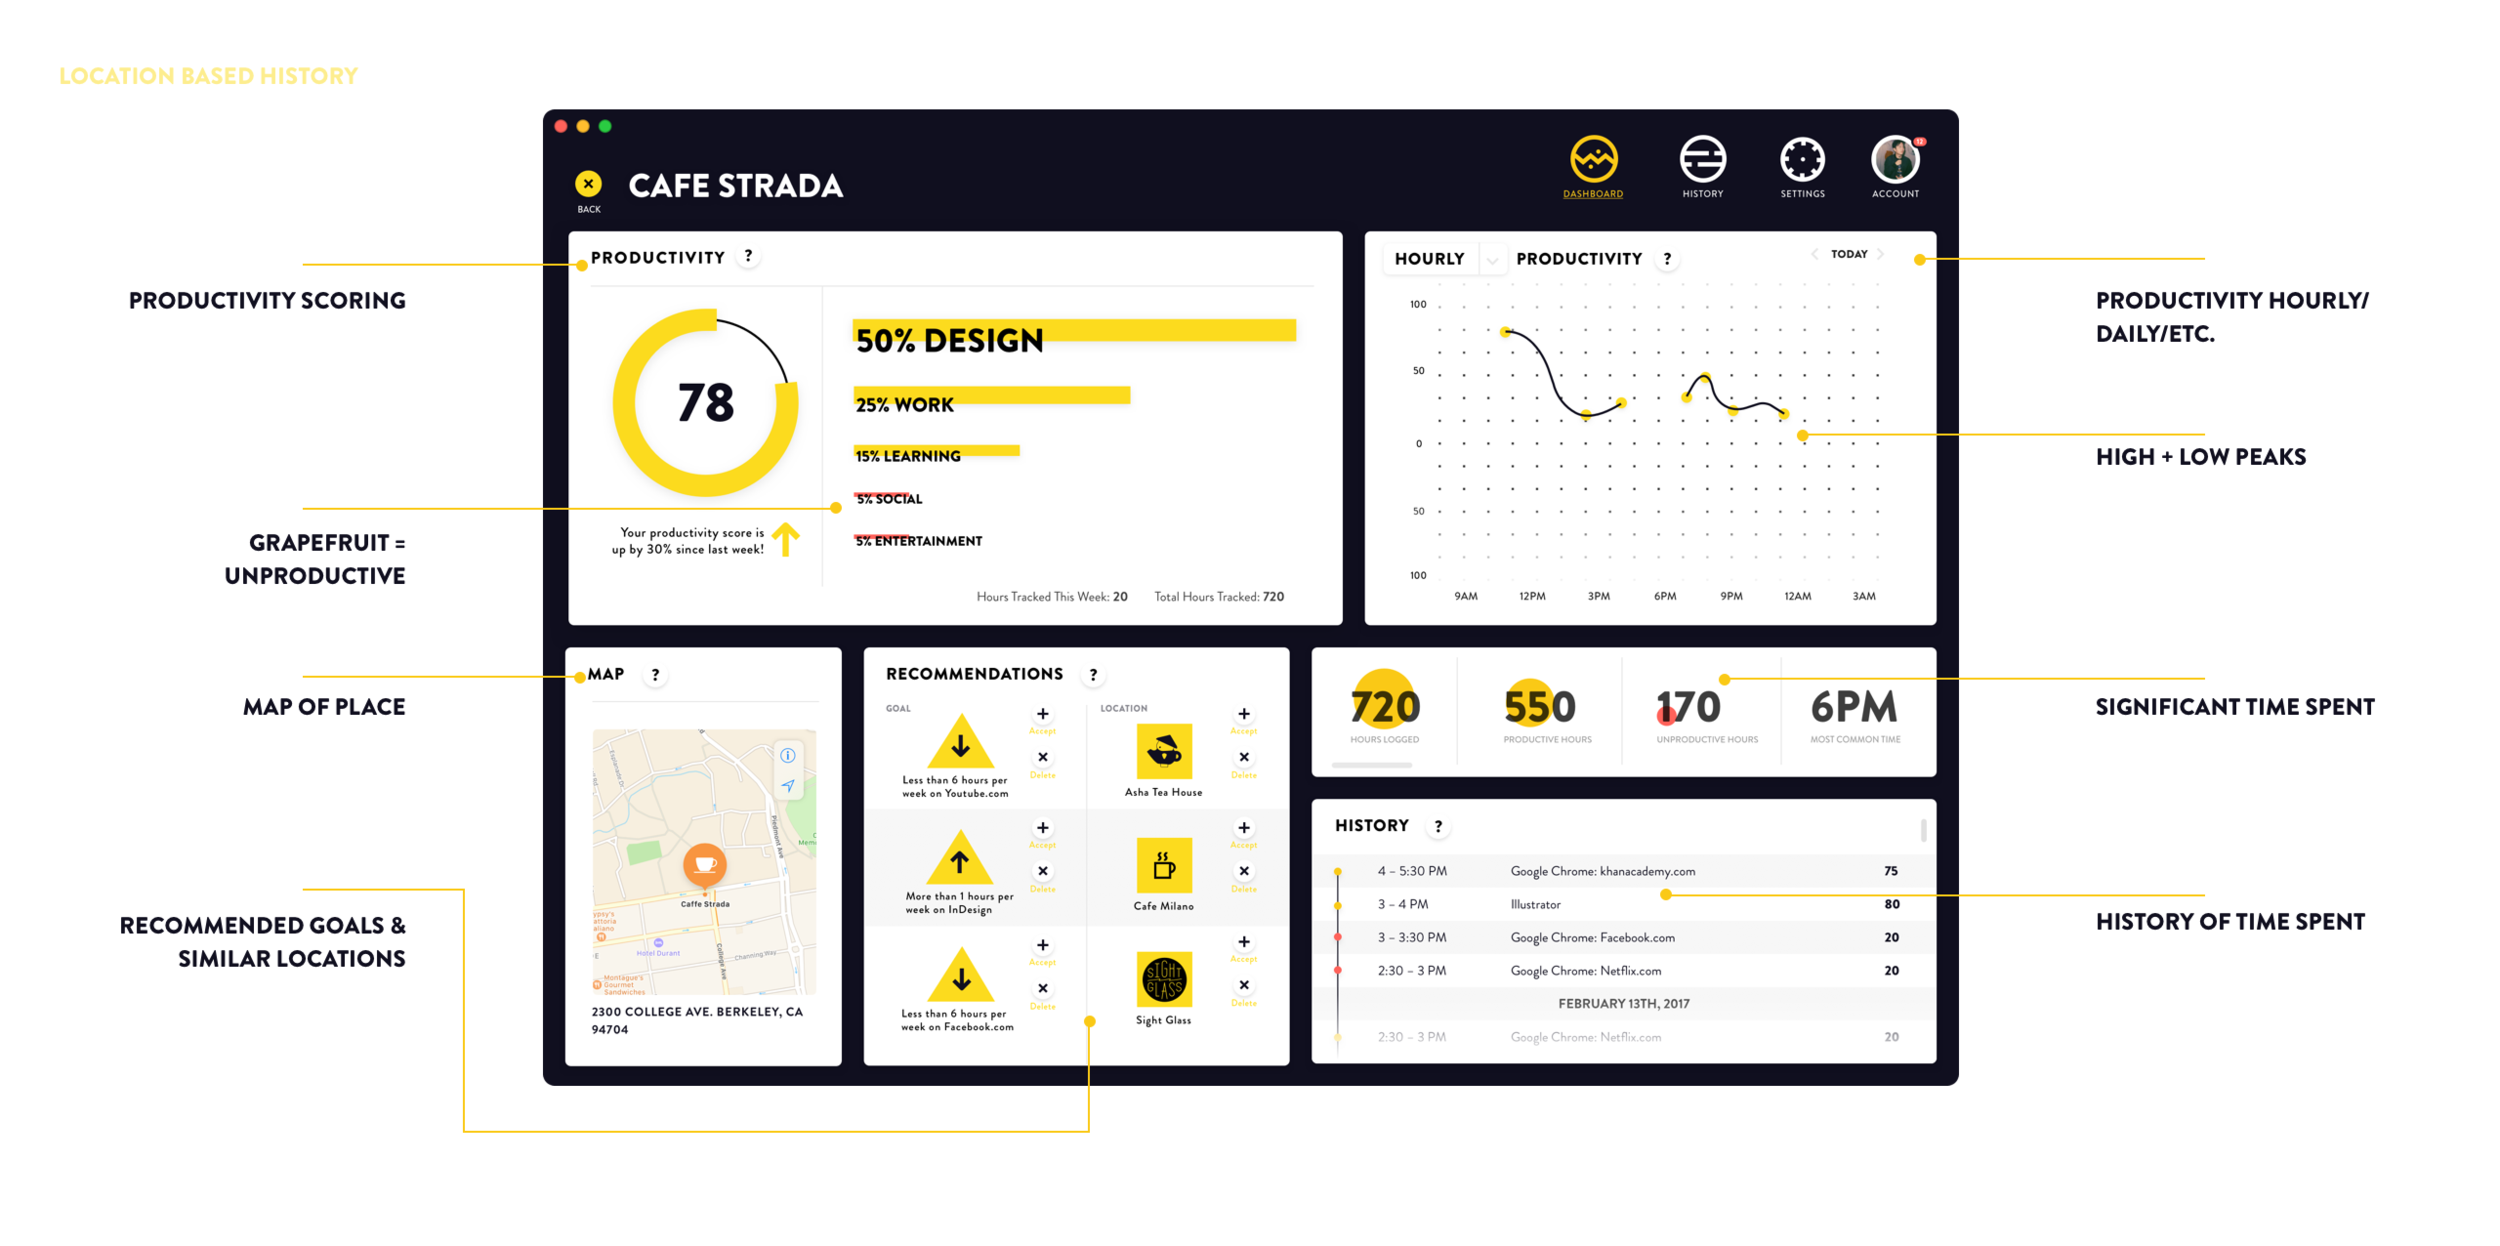
LOCATION BASED HISTORY
Having a location based history allows users to understand how they spend their time at specific locations. Spending time at a distinct location, finding similar locations, & monitoring how you spent your time will allow users to better navigate where they will spend their time either at that place or at a new place, next time.
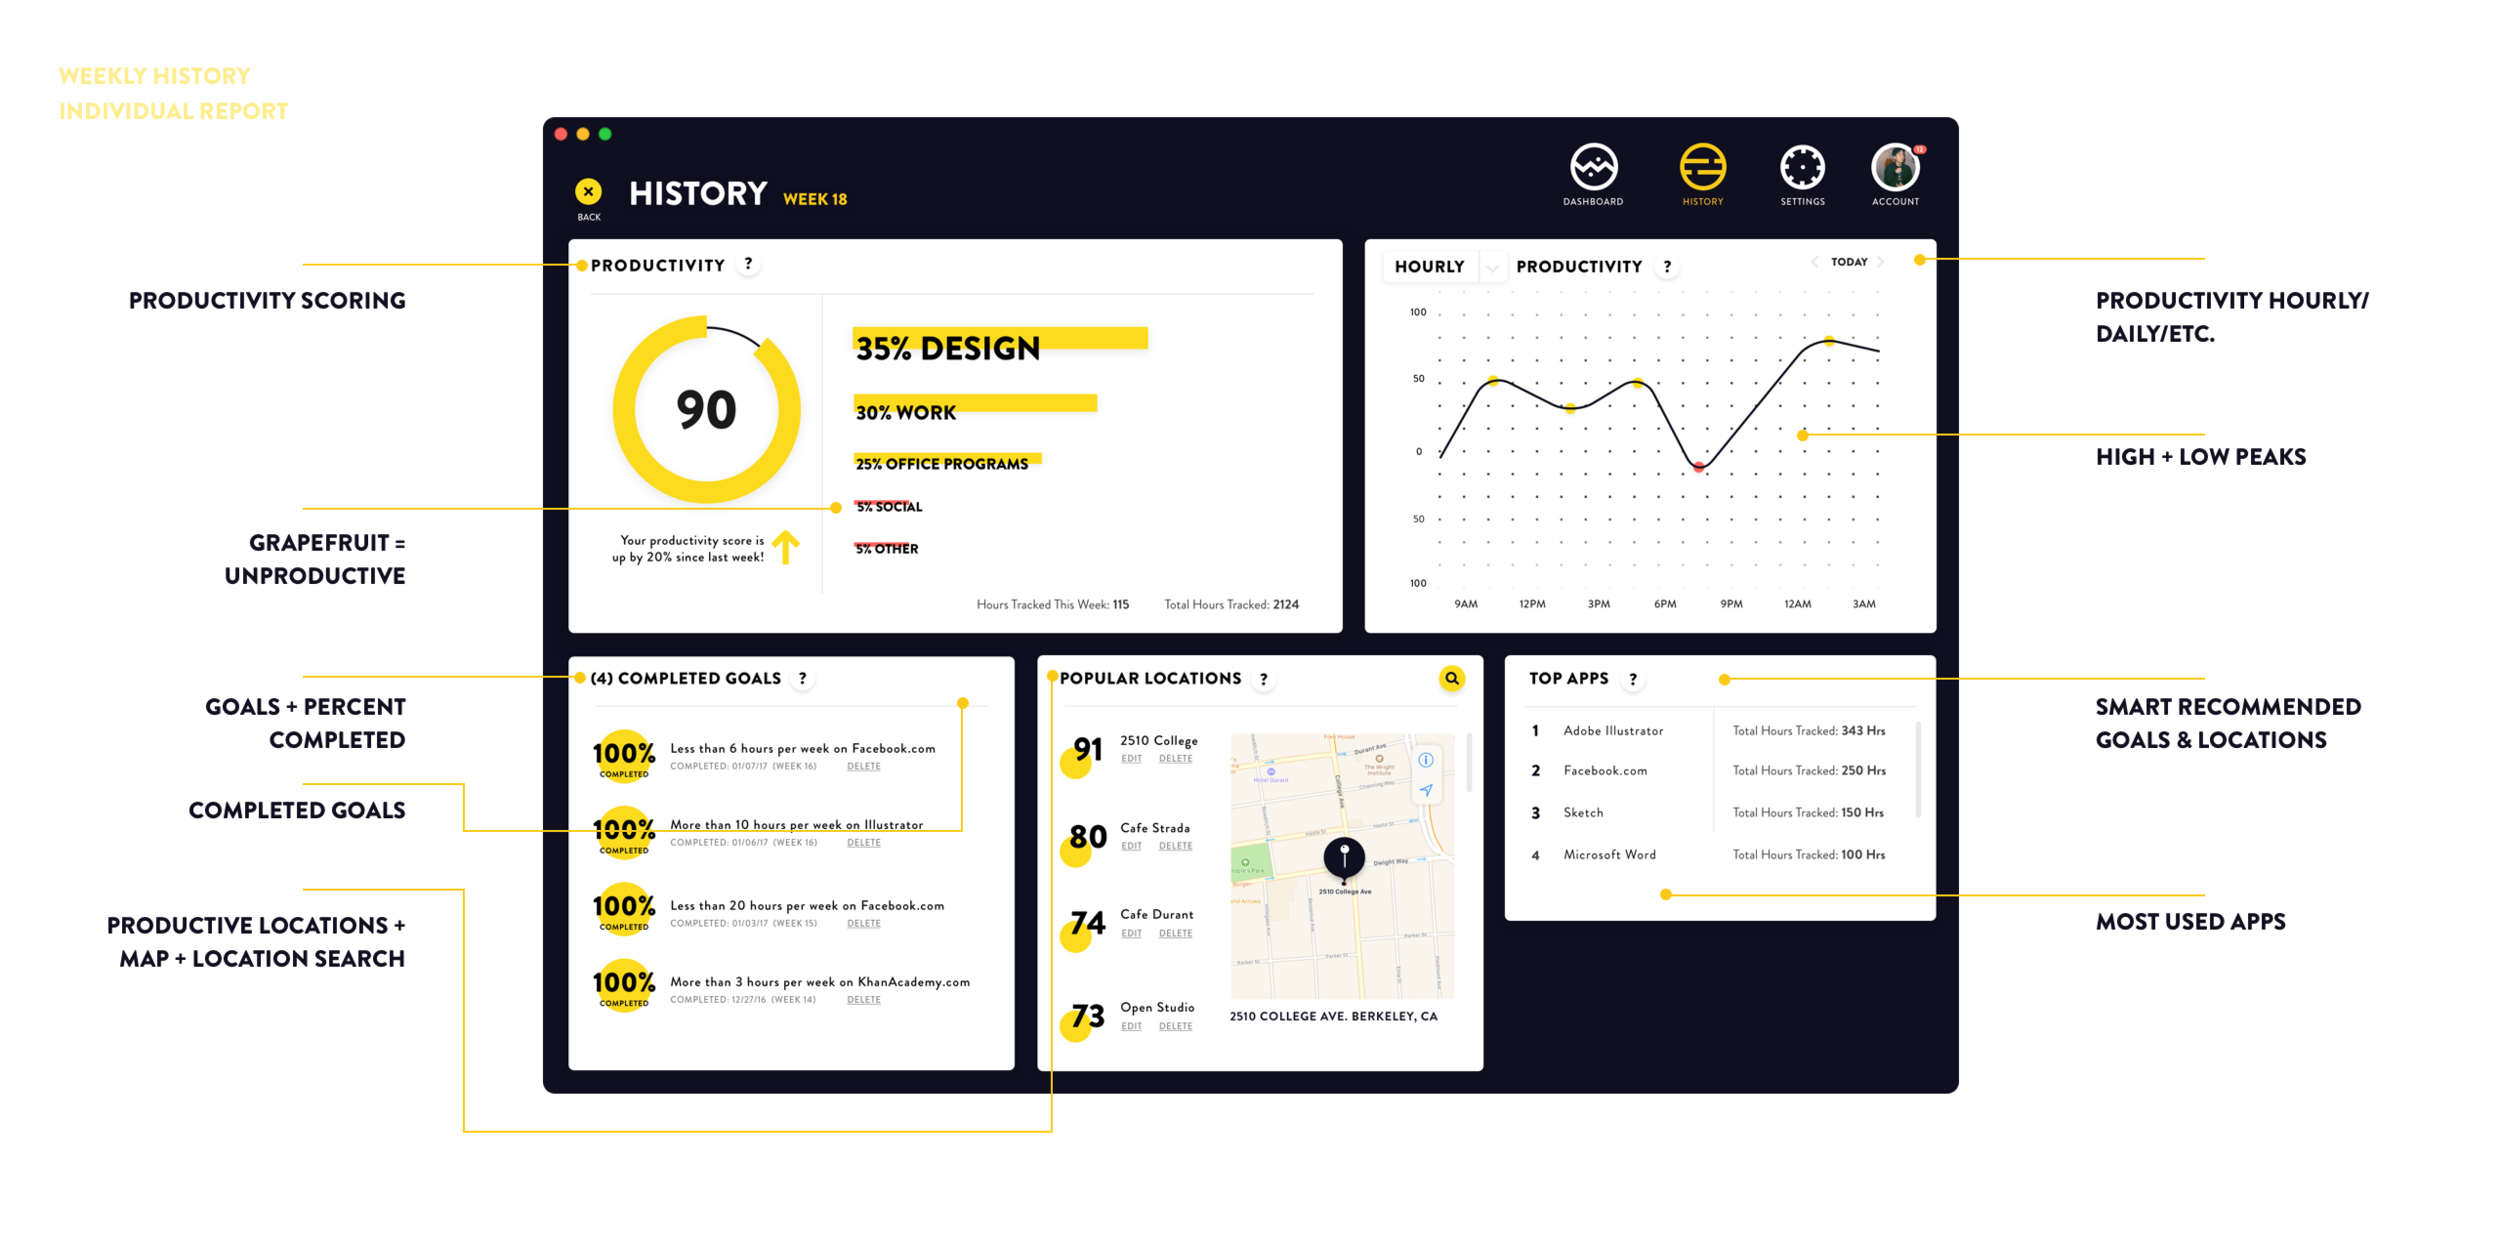
INDIVIDUAL WEEKLY HISTORY REPORTS
A fascinating features that could help users work harder, would be to evaluate their previous weeks. This allows them to see how well they performed each week in relation to one another, over time learning more about their habits & reinforcing productivity with past accomplishments.
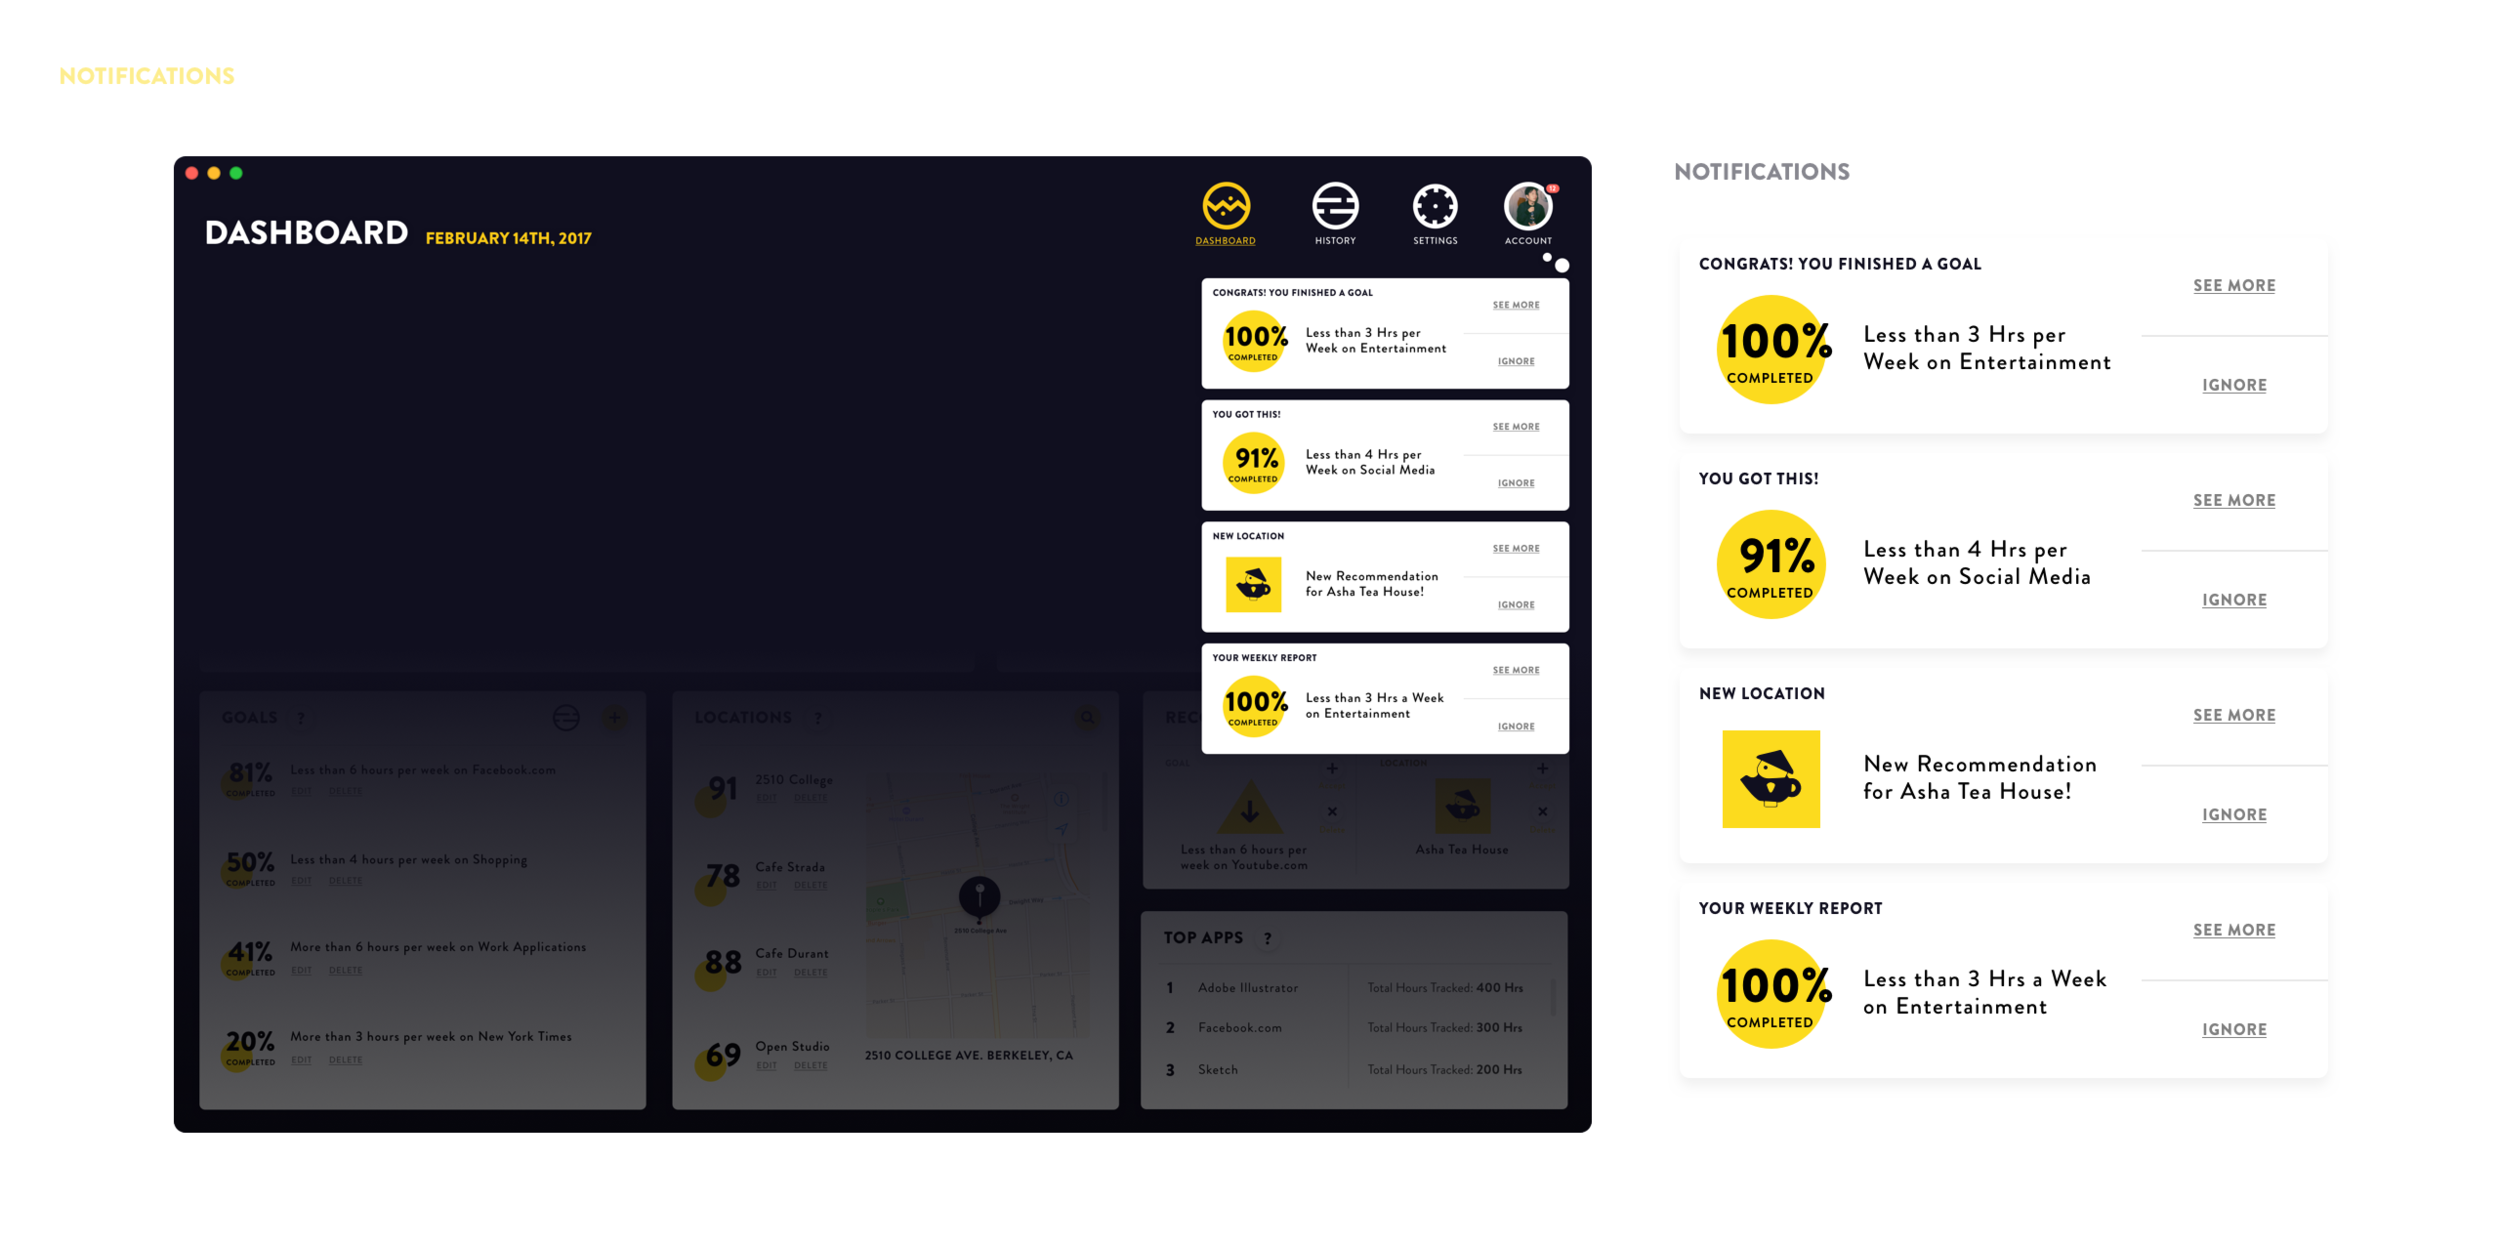
NOTIFICATIONS
Notifications are simple & clear. They notify the user when goals are approaching their limits, have been completed, when new locations have been recommended, new weekly reports & more.
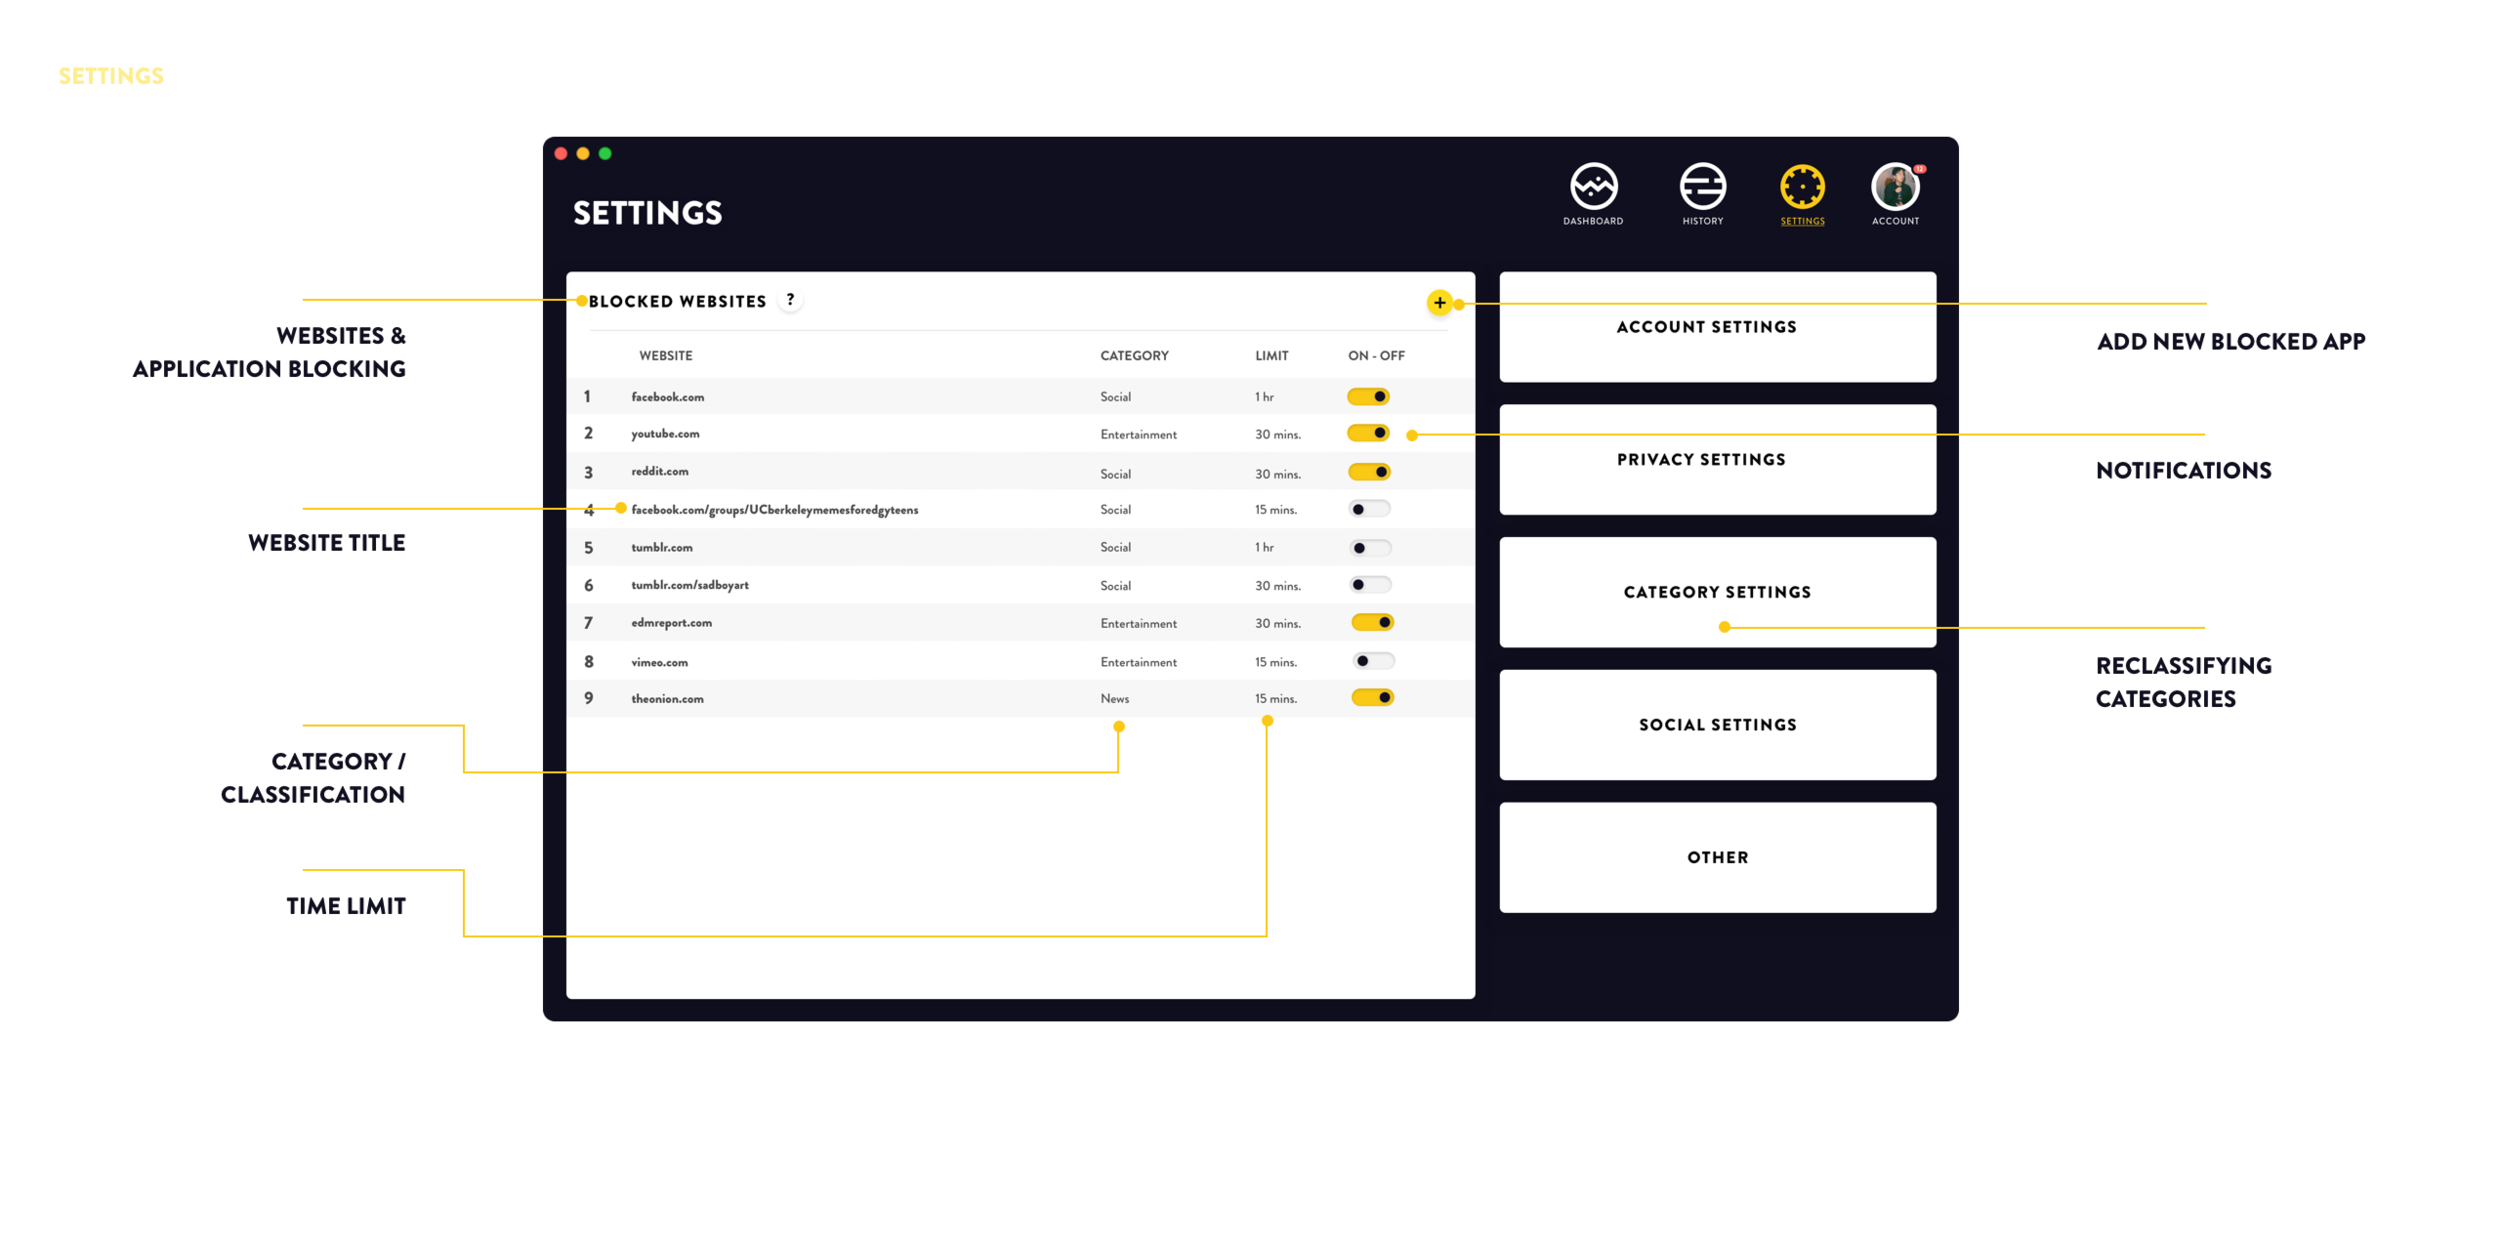
BLOCKED WEBSITES & SETTINGS
The settings page allows you to evaluate what websites will be limited in Tyme & how often they will be limited. In category settings you can reclassify what Tyme accidentally will categorize on its own to be unproductive, if you find it to be a productive task, ie. an activity such that a Digital Marketer must use Facebook in order to do be productive. Likewise settings for how Tyme works with other applications is in the settings tab.
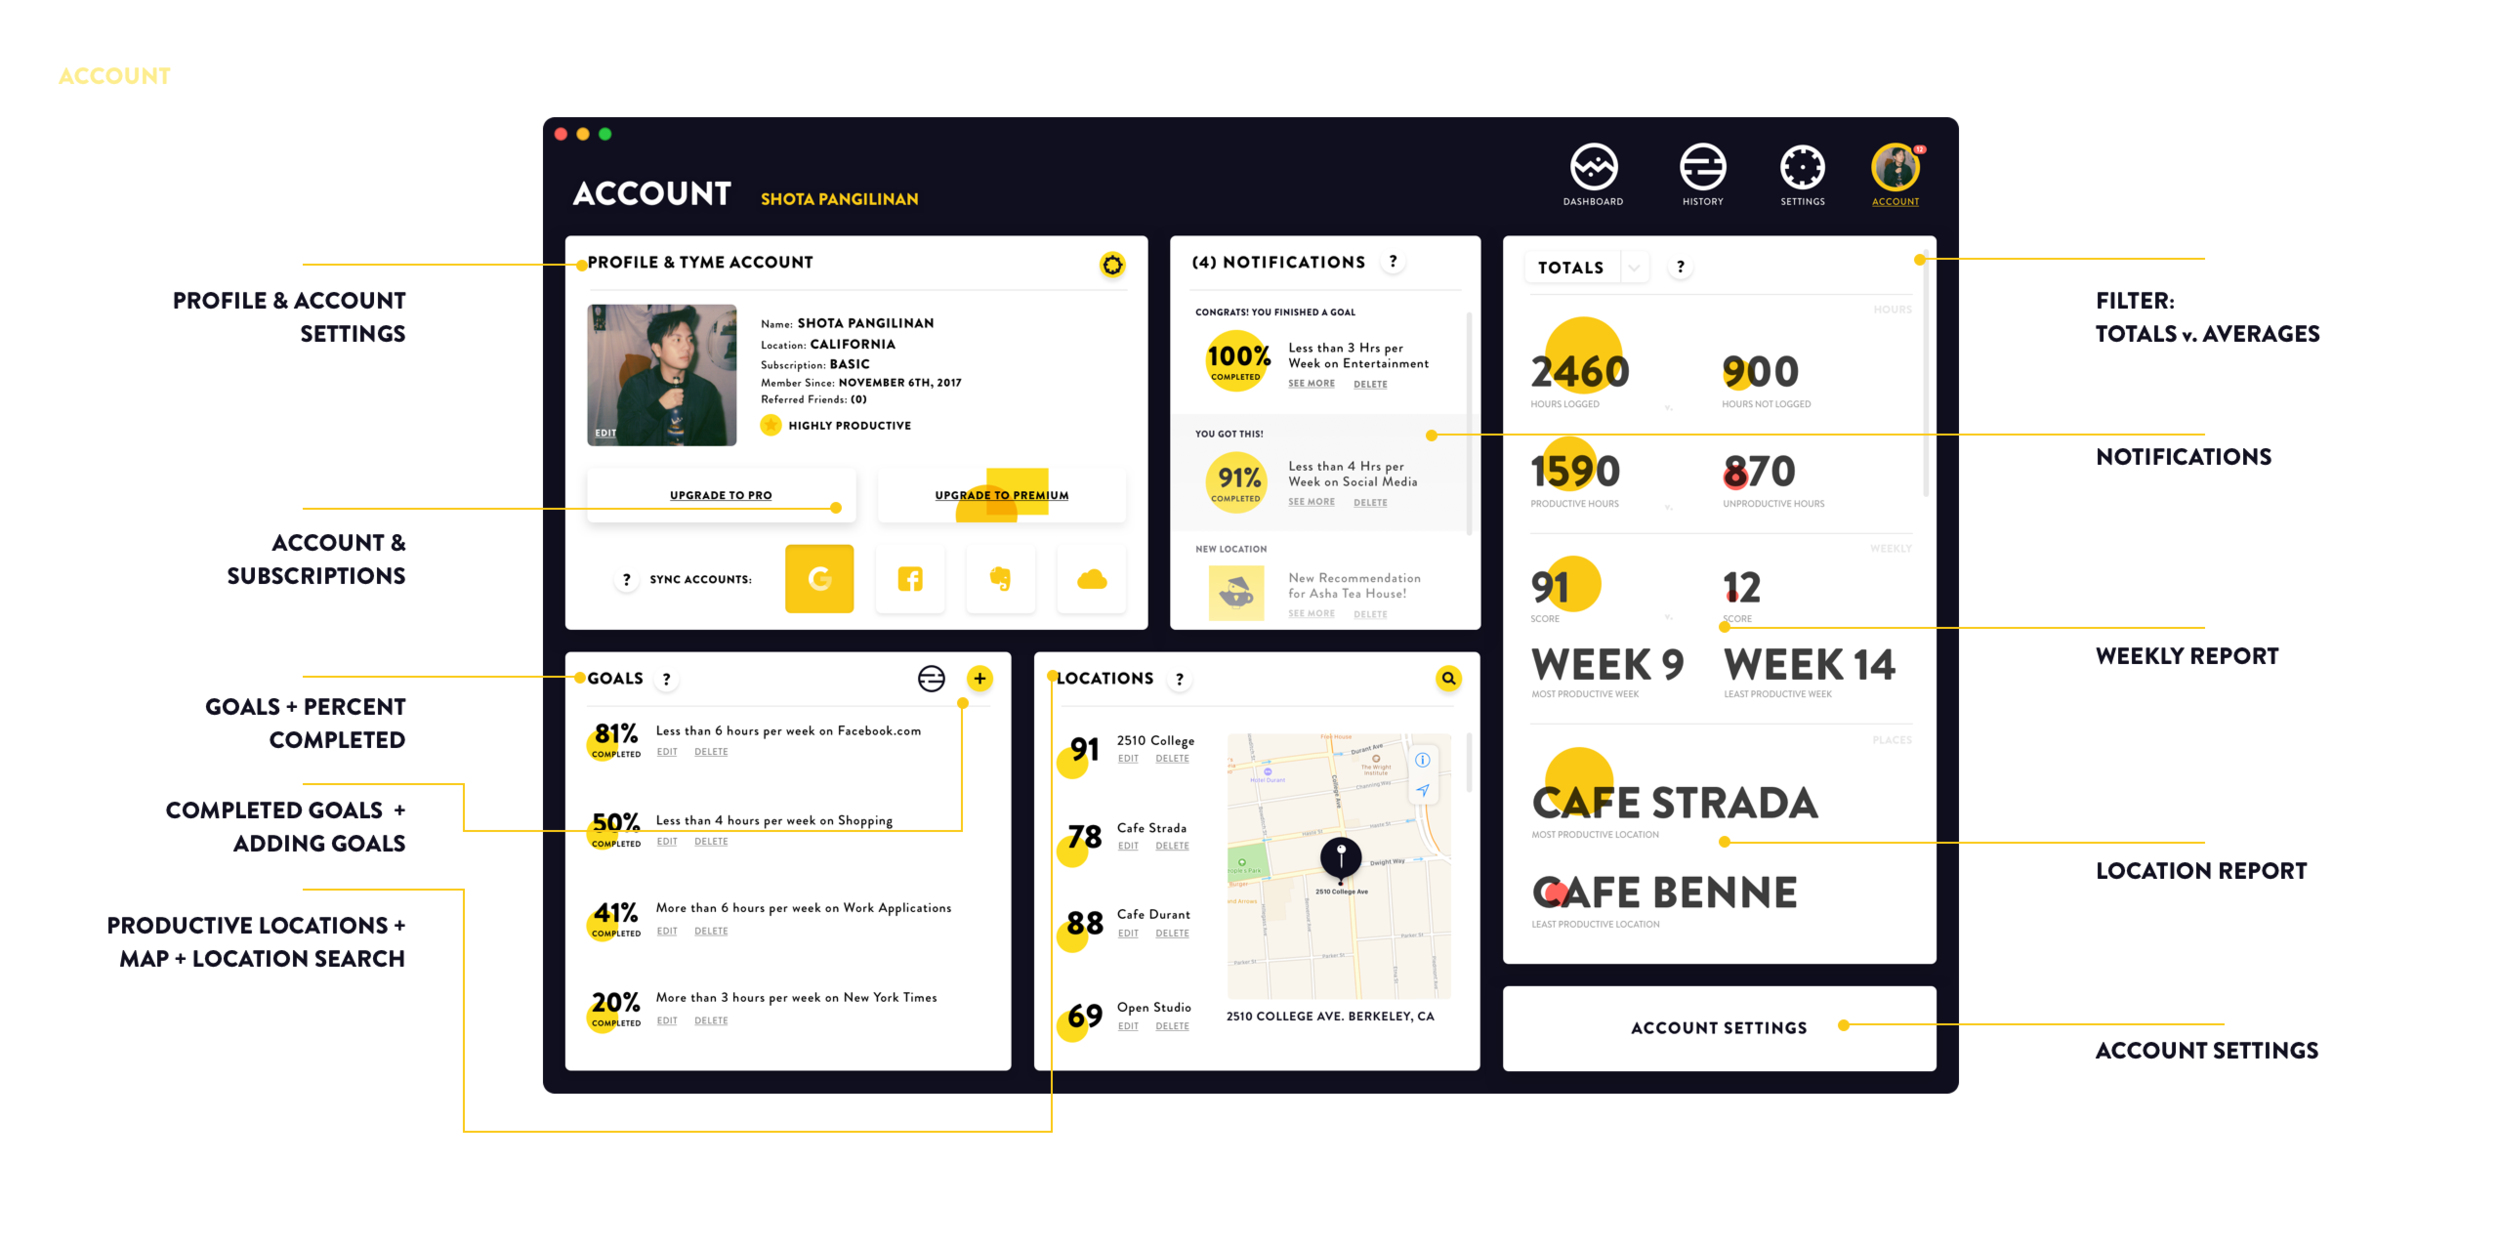
ACCOUNT & PROFILE
The profile page has much more pertinent information, regarding syncing with other existing accounts, upgrading to pro & premium versions of the application & other data taken from other pages within Tyme.
PROTOTYPE HERE
REFLECTION
Coming back & redesigning this product was an amazing learning & growing experience. It's funny how even in the course of a couple months or a year that you can come to rethink and re-design things so differently. In total, in this second attempt I spent only about 2 days or 10 hours each day working on these designs. I thought a lot about it since last semester, but only now did I really jump on the experience of being able to come revisit it.
Lessons📔
People want to use technology to help them, but they don't always stick to it
Data Visualization is an ART & HARD.
Having a playful company name can be fun, but doesn't really add to its value unless its directly relevant (i.e. Acorn)
Measuring the success of your application takes time & a thorough understanding of your demographic.
Revisiting old designs allows you to come to tackle the problem from an entirely new perspective.